Report Summary

  • 24

    Performance

    Renders faster than
    43% of other websites

  • 95

    Accessibility

    Visual factors better than
    that of 86% of websites

  • 75

    Best Practices

    More advanced features
    available than in
    35% of websites

  • 98

    SEO

    Google-friendlier than
    92% of websites

blueboard.co

Personalized Employee Rewards and Recognition Experiences | Blueboard

Page Load Speed

2 sec in total

First Response

157 ms

Resources Loaded

1.5 sec

Page Rendered

416 ms
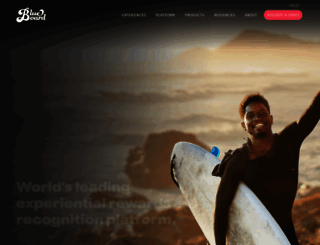
blueboard.co screenshot

About Website

Click here to check amazing Blueboard content for United States. Otherwise, check out these important facts you probably never knew about blueboard.co

Ready to reimagine your employee rewards and recognition program? Blueboard's unique experiences help increase employee engagement and retention. Discover how.

Visit blueboard.co

Key Findings

We analyzed Blueboard.co page load time and found that the first response time was 157 ms and then it took 1.9 sec to load all DOM resources and completely render a web page. This is quite a good result, as only 40% of websites can load faster.

Performance Metrics

blueboard.co performance score

24

Measured Metrics

name

value

score

weighting

FCP (First Contentful Paint)

Value3.0 s

49/100

10%

LCP (Largest Contentful Paint)

Value17.5 s

0/100

25%

SI (Speed Index)

Value7.8 s

24/100

10%

TBT (Total Blocking Time)

Value2,180 ms

6/100

30%

CLS (Cumulative Layout Shift)

Value0.04

99/100

15%

TTI (Time to Interactive)

Value17.0 s

4/100

10%

Network Requests Diagram

blueboard.co

157 ms

www.blueboard.com

176 ms

app-833fd3b9ac73963a489c.css

198 ms

font-awesome.min.css

74 ms

pace-theme-minimal.css

87 ms

Our browser made a total of 46 requests to load all elements on the main page. We found that 2% of them (1 request) were addressed to the original Blueboard.co, 33% (15 requests) were made to Blueboard.com and 7% (3 requests) were made to Cdnjs.cloudflare.com. The less responsive or slowest element that took the longest time to load (833 ms) relates to the external source Blueboard.com.

Page Optimization Overview & Recommendations

Page size can be reduced by 939.2 kB (51%)

Content Size

1.8 MB

After Optimization

893.1 kB

In fact, the total size of Blueboard.co main page is 1.8 MB. This result falls beyond the top 1M of websites and identifies a large and not optimized web page that may take ages to load. 65% of websites need less resources to load. Javascripts take 1.2 MB which makes up the majority of the site volume.

HTML Optimization

-45%

Potential reduce by 37.7 kB

  • Original 84.2 kB
  • After minification 84.2 kB
  • After compression 46.5 kB

HTML content can be minified and compressed by a website’s server. The most efficient way is to compress content using GZIP which reduces data amount travelling through the network between server and browser. HTML code on this page is well minified. It is highly recommended that content of this web page should be compressed using GZIP, as it can save up to 37.7 kB or 45% of the original size.

Image Optimization

-1%

Potential reduce by 3.9 kB

  • Original 398.4 kB
  • After minification 394.6 kB

Image size optimization can help to speed up a website loading time. The chart above shows the difference between the size before and after optimization. Blueboard images are well optimized though.

JavaScript Optimization

-65%

Potential reduce by 752.3 kB

  • Original 1.2 MB
  • After minification 1.2 MB
  • After compression 411.3 kB

It’s better to minify JavaScript in order to improve website performance. The diagram shows the current total size of all JavaScript files against the prospective JavaScript size after its minification and compression. It is highly recommended that all JavaScript files should be compressed and minified as it can save up to 752.3 kB or 65% of the original size.

CSS Optimization

-78%

Potential reduce by 145.4 kB

  • Original 186.1 kB
  • After minification 185.9 kB
  • After compression 40.8 kB

CSS files minification is very important to reduce a web page rendering time. The faster CSS files can load, the earlier a page can be rendered. Blueboard.co needs all CSS files to be minified and compressed as it can save up to 145.4 kB or 78% of the original size.

Requests Breakdown

Number of requests can be reduced by 22 (58%)

Requests Now

38

After Optimization

16

The browser has sent 38 CSS, Javascripts, AJAX and image requests in order to completely render the main page of Blueboard. We recommend that multiple CSS and JavaScript files should be merged into one by each type, as it can help reduce assets requests from 18 to 1 for JavaScripts and as a result speed up the page load time.

Accessibility Review

blueboard.co accessibility score

95

Accessibility Issues

Contrast

These are opportunities to improve the legibility of your content.

Impact

Issue

High

Background and foreground colors do not have a sufficient contrast ratio.

Navigation

These are opportunities to improve keyboard navigation in your application.

Impact

Issue

High

Heading elements are not in a sequentially-descending order

Names and labels

These are opportunities to improve the semantics of the controls in your application. This may enhance the experience for users of assistive technology, like a screen reader.

Impact

Issue

High

Links do not have a discernible name

Best Practices

blueboard.co best practices score

75

Areas of Improvement

Trust and Safety

Impact

Issue

High

Does not use HTTPS

High

Includes front-end JavaScript libraries with known security vulnerabilities

Low

Ensure CSP is effective against XSS attacks

General

Impact

Issue

Low

Detected JavaScript libraries

High

Browser errors were logged to the console

High

Missing source maps for large first-party JavaScript

SEO Factors

blueboard.co SEO score

98

Search Engine Optimization Advices

Mobile Friendly

Make sure your pages are mobile friendly so users don’t have to pinch or zoom in order to read the content pages. [Learn more](https://developers.google.com/search/mobile-sites/).

Impact

Issue

High

Document uses legible font sizes

High

Tap targets are not sized appropriately

Language and Encoding

  • Language Detected

    EN

  • Language Claimed

    N/A

  • Encoding

    N/A

Language claimed in HTML meta tag should match the language actually used on the web page. Otherwise Blueboard.co can be misinterpreted by Google and other search engines. Our service has detected that English is used on the page, and neither this language nor any other was claimed in <html> or <meta> tags. Our system also found out that Blueboard.co main page’s claimed encoding is . Changing it to UTF-8 can be a good choice, as this format is commonly used for encoding all over the web and thus their visitors won’t have any troubles with symbol transcription or reading.

Social Sharing Optimization

Open Graph description is not detected on the main page of Blueboard. Lack of Open Graph description can be counter-productive for their social media presence, as such a description allows converting a website homepage (or other pages) into good-looking, rich and well-structured posts, when it is being shared on Facebook and other social media. For example, adding the following code snippet into HTML <head> tag will help to represent this web page correctly in social networks: