Report Summary

  • 16

    Performance

    Renders faster than
    30% of other websites

  • 96

    Accessibility

    Visual factors better than
    that of 89% of websites

  • 92

    Best Practices

    More advanced features
    available than in
    81% of websites

  • 93

    SEO

    Google-friendlier than
    84% of websites

buttonmedia.net

Button Media - Video Production Services - Hello and Welcome

Page Load Speed

6.6 sec in total

First Response

215 ms

Resources Loaded

5.9 sec

Page Rendered

453 ms
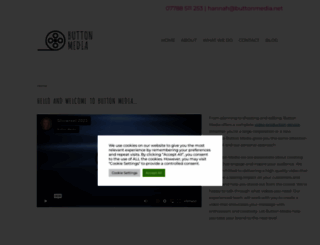
buttonmedia.net screenshot

About Website

Click here to check amazing Button Media content. Otherwise, check out these important facts you probably never knew about buttonmedia.net

From scripting to shooting and editing, Button Media offers a complete video production service. Whether you're a large corporation or a new business.

Visit buttonmedia.net

Key Findings

We analyzed Buttonmedia.net page load time and found that the first response time was 215 ms and then it took 6.4 sec to load all DOM resources and completely render a web page. This is a poor result, as 80% of websites can load faster.

Performance Metrics

buttonmedia.net performance score

16

Measured Metrics

name

value

score

weighting

FCP (First Contentful Paint)

Value3.3 s

39/100

10%

LCP (Largest Contentful Paint)

Value10.5 s

0/100

25%

SI (Speed Index)

Value15.9 s

0/100

10%

TBT (Total Blocking Time)

Value3,500 ms

1/100

30%

CLS (Cumulative Layout Shift)

Value0.154

75/100

15%

TTI (Time to Interactive)

Value14.6 s

8/100

10%

Network Requests Diagram

buttonmedia.net

215 ms

buttonmedia.net

3830 ms

YyhlLmNvbmNhdGVtb2ppKTplLndwZW1vamkmJmUudHdlbW9qaSYmKGMoZS50d2Vtb2ppKSxjKGUud3BlbW9qaSkpKX0od2luZG93LGRvY3VtZW50LHdpbmRvdy5fd3BlbW9qaVNldHRpbmdzKTsK

13 ms

style.min.css

91 ms

autoptimize_single_20e8490fab0dcf7557a5c8b54494db6f.php

178 ms

Our browser made a total of 78 requests to load all elements on the main page. We found that 56% of them (44 requests) were addressed to the original Buttonmedia.net, 17% (13 requests) were made to and 13% (10 requests) were made to Player.vimeo.com. The less responsive or slowest element that took the longest time to load (3.8 sec) belongs to the original domain Buttonmedia.net.

Page Optimization Overview & Recommendations

Page size can be reduced by 138.7 kB (15%)

Content Size

920.8 kB

After Optimization

782.1 kB

In fact, the total size of Buttonmedia.net main page is 920.8 kB. This result falls beyond the top 1M of websites and identifies a large and not optimized web page that may take ages to load. 40% of websites need less resources to load. Images take 419.1 kB which makes up the majority of the site volume.

HTML Optimization

-75%

Potential reduce by 93.5 kB

  • Original 125.2 kB
  • After minification 125.0 kB
  • After compression 31.7 kB

HTML content can be minified and compressed by a website’s server. The most efficient way is to compress content using GZIP which reduces data amount travelling through the network between server and browser. HTML code on this page is well minified. It is highly recommended that content of this web page should be compressed using GZIP, as it can save up to 93.5 kB or 75% of the original size.

Image Optimization

-10%

Potential reduce by 43.4 kB

  • Original 419.1 kB
  • After minification 375.7 kB

Image size optimization can help to speed up a website loading time. The chart above shows the difference between the size before and after optimization. Button Media images are well optimized though.

JavaScript Optimization

-1%

Potential reduce by 1.6 kB

  • Original 314.3 kB
  • After minification 314.3 kB
  • After compression 312.7 kB

It’s better to minify JavaScript in order to improve website performance. The diagram shows the current total size of all JavaScript files against the prospective JavaScript size after its minification and compression. This website has mostly compressed JavaScripts.

CSS Optimization

-0%

Potential reduce by 148 B

  • Original 62.2 kB
  • After minification 62.2 kB
  • After compression 62.1 kB

CSS files minification is very important to reduce a web page rendering time. The faster CSS files can load, the earlier a page can be rendered. Buttonmedia.net has all CSS files already compressed.

Requests Breakdown

Number of requests can be reduced by 41 (68%)

Requests Now

60

After Optimization

19

The browser has sent 60 CSS, Javascripts, AJAX and image requests in order to completely render the main page of Button Media. We recommend that multiple CSS and JavaScript files should be merged into one by each type, as it can help reduce assets requests from 20 to 1 for JavaScripts and from 23 to 1 for CSS and as a result speed up the page load time.

Accessibility Review

buttonmedia.net accessibility score

96

Accessibility Issues

Contrast

These are opportunities to improve the legibility of your content.

Impact

Issue

High

Background and foreground colors do not have a sufficient contrast ratio.

Navigation

These are opportunities to improve keyboard navigation in your application.

Impact

Issue

High

Heading elements are not in a sequentially-descending order

Best Practices

buttonmedia.net best practices score

92

Areas of Improvement

Trust and Safety

Impact

Issue

High

Does not use HTTPS

Low

Ensure CSP is effective against XSS attacks

General

Impact

Issue

Low

Detected JavaScript libraries

SEO Factors

buttonmedia.net SEO score

93

Search Engine Optimization Advices

Crawling and Indexing

To appear in search results, crawlers need access to your app.

Impact

Issue

High

Links are not crawlable

Mobile Friendly

Make sure your pages are mobile friendly so users don’t have to pinch or zoom in order to read the content pages. [Learn more](https://developers.google.com/search/mobile-sites/).

Impact

Issue

High

Document uses legible font sizes

Language and Encoding

  • Language Detected

    EN

  • Language Claimed

    EN

  • Encoding

    UTF-8

Language claimed in HTML meta tag should match the language actually used on the web page. Otherwise Buttonmedia.net can be misinterpreted by Google and other search engines. Our service has detected that English is used on the page, and it matches the claimed language. Our system also found out that Buttonmedia.net main page’s claimed encoding is utf-8. Use of this encoding format is the best practice as the main page visitors from all over the world won’t have any issues with symbol transcription.

Social Sharing Optimization

Open Graph data is detected on the main page of Button Media. This is the best way to make the web page social media friendly. Here is how it looks like on Facebook: