6.6 sec in total
103 ms
5.7 sec
816 ms
Click here to check amazing Capexplan content for India. Otherwise, check out these important facts you probably never knew about capexplan.com
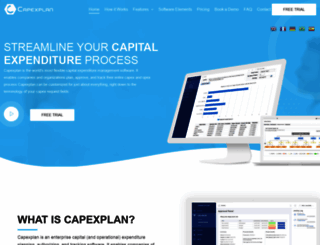
Capexplan is a complete capex software. It helps companies budget, approve, track, and report on their capital and operational expenditures.
Visit capexplan.comWe analyzed Capexplan.com page load time and found that the first response time was 103 ms and then it took 6.5 sec to load all DOM resources and completely render a web page. This is a poor result, as 80% of websites can load faster.
capexplan.com performance score
name
value
score
weighting
Value7.8 s
0/100
10%
Value24.2 s
0/100
25%
Value18.2 s
0/100
10%
Value3,610 ms
1/100
30%
Value0.289
41/100
15%
Value26.7 s
0/100
10%
103 ms
75 ms
93 ms
65 ms
58 ms
Our browser made a total of 190 requests to load all elements on the main page. We found that 86% of them (164 requests) were addressed to the original Capexplan.com, 2% (4 requests) were made to Googletagmanager.com and 2% (3 requests) were made to Widget-v4.tidiochat.com. The less responsive or slowest element that took the longest time to load (1.1 sec) relates to the external source Snid.snitcher.com.
Page size can be reduced by 286.0 kB (52%)
546.2 kB
260.2 kB
In fact, the total size of Capexplan.com main page is 546.2 kB. This result falls beyond the top 1M of websites and identifies a large and not optimized web page that may take ages to load. 75% of websites need less resources to load and that’s why Accessify’s recommendations for optimization and resource minification can be helpful for this project. HTML takes 313.1 kB which makes up the majority of the site volume.
Potential reduce by 269.5 kB
HTML content can be minified and compressed by a website’s server. The most efficient way is to compress content using GZIP which reduces data amount travelling through the network between server and browser. HTML code on this page is well minified. It is highly recommended that content of this web page should be compressed using GZIP, as it can save up to 269.5 kB or 86% of the original size.
Potential reduce by 184 B
Image size optimization can help to speed up a website loading time. The chart above shows the difference between the size before and after optimization. Capexplan images are well optimized though.
Potential reduce by 16.2 kB
It’s better to minify JavaScript in order to improve website performance. The diagram shows the current total size of all JavaScript files against the prospective JavaScript size after its minification and compression. It is highly recommended that all JavaScript files should be compressed and minified as it can save up to 16.2 kB or 25% of the original size.
Number of requests can be reduced by 152 (86%)
176
24
The browser has sent 176 CSS, Javascripts, AJAX and image requests in order to completely render the main page of Capexplan. We recommend that multiple CSS and JavaScript files should be merged into one by each type, as it can help reduce assets requests from 77 to 1 for JavaScripts and from 54 to 1 for CSS and as a result speed up the page load time.
www.capexplan.com
103 ms
js
75 ms
all.min.css
93 ms
bootstrap.min.css
65 ms
front.css
58 ms
General.css
56 ms
Accordion.css
54 ms
owl.carousel.min.css
67 ms
blog.css
107 ms
Button.css
108 ms
Icon_Box.css
109 ms
magnific-popup.css
110 ms
Popup_Video.css
109 ms
Section_Title.css
132 ms
Slider_With_Text.css
150 ms
general.css
149 ms
style.css
151 ms
eae.min.css
183 ms
peel.css
152 ms
v4-shims.min.css
172 ms
all.min.css
194 ms
vegas.min.css
191 ms
upcoming-appointments.css
192 ms
ssa-styles.css
196 ms
css
45 ms
bootstrap.min.css
244 ms
ionicons.min.css
226 ms
typicon.min.css
230 ms
select2.css
232 ms
font-awesome.min.css
234 ms
wow.css
237 ms
global.min.css
316 ms
dummy.min.css
296 ms
button.min.css
271 ms
sidebar.min.css
274 ms
widgets.min.css
277 ms
dflip.min.css
293 ms
ekiticons.css
336 ms
jquery-ui.css
39 ms
css
61 ms
jquery-3.6.0.min.js
31 ms
js
84 ms
js
84 ms
lord-icon-2.1.0.js
53 ms
jquery-ui.js
30 ms
instant-answer.css
313 ms
betterdocs-el-edit.css
272 ms
custom-frontend-lite.min.css
293 ms
swiper.min.css
287 ms
lordicon.js
4 ms
post-17.css
296 ms
custom-pro-frontend-lite.min.css
303 ms
global.css
281 ms
post-41589.css
288 ms
jquery-ui-slider-pips.min.css
280 ms
pricing_slider_style.css
283 ms
widget-styles.css
338 ms
responsive.css
305 ms
custom-widget-icon-list.min.css
290 ms
post-40432.css
284 ms
post-6284.css
284 ms
animations.min.css
285 ms
frontend-gtag.min.js
330 ms
popper.min.js
311 ms
bootstrap.min.js
314 ms
front.js
311 ms
iconHelper.js
310 ms
hooks.min.js
378 ms
i18n.min.js
601 ms
jquery.form.min.js
570 ms
General.js
687 ms
Accordion.js
686 ms
owl-general.js
681 ms
owl.carousel.min.js
849 ms
Icon_Box.js
850 ms
jquery.magnific-popup.min.js
826 ms
Popup_Video.js
879 ms
Slider.js
875 ms
general.js
857 ms
jquery.particleground.min.js
859 ms
main.js
849 ms
eae.min.js
854 ms
render.5ebf9a594610a33e649a.js
49 ms
index.min.js
857 ms
v4-shims.min.js
846 ms
animated-main.min.js
845 ms
particles.min.js
849 ms
magnific.min.js
853 ms
vegas.min.js
851 ms
bootstrap.min.js
856 ms
smooth-scrollbar.js
848 ms
semantic-ui-range.js
841 ms
select2.js
888 ms
wow.min.js
848 ms
superfish.js
842 ms
custom.min.js
841 ms
dflip.min.js
907 ms
frontend-script.js
837 ms
widget-scripts.js
870 ms
react.min.js
855 ms
react-dom.min.js
949 ms
wp-polyfill.min.js
863 ms
url.min.js
865 ms
gtm.js
288 ms
tracking.min.js
579 ms
8415452.js
1083 ms
sp.js
604 ms
lftracker_v1_p1e024B66DX4GB6d.js
634 ms
inspectlet.js
550 ms
api-fetch.min.js
872 ms
font
281 ms
font
462 ms
escape-html.min.js
826 ms
font
327 ms
element.min.js
648 ms
html-entities.min.js
716 ms
instant-answer.js
638 ms
jquery-ui-slider-pips.min.js
617 ms
dropdown.js
544 ms
jquery-numerator.min.js
461 ms
webpack-pro.runtime.min.js
457 ms
webpack.runtime.min.js
480 ms
777949270
142 ms
frontend-modules.min.js
540 ms
frontend.min.js
560 ms
waypoints.min.js
559 ms
core.min.js
556 ms
frontend.min.js
546 ms
elements-handlers.min.js
557 ms
animate-circle.min.js
612 ms
elementor.js
612 ms
jquery.sticky.min.js
617 ms
underscore.min.js
612 ms
wp-util.min.js
604 ms
frontend.min.js
606 ms
elementskit.woff
934 ms
Now-Regular.woff
787 ms
Now-Medium.woff
807 ms
Now-Bold.woff
837 ms
tr-rc.lfeeder.com
70 ms
fontawesome-webfont.woff
897 ms
fa-v4compatibility.ttf
865 ms
fa-regular-400.ttf
864 ms
fa-brands-400.ttf
994 ms
fa-solid-900.ttf
917 ms
ionicons.ttf
968 ms
loader.gif
859 ms
capex-website-logo-white230.png
856 ms
capex-website-logo-white.png
856 ms
gear1.png
841 ms
satisfaction1.png
838 ms
all-inclusive.png
837 ms
solution.png
902 ms
ptn-3_result.png
840 ms
ptn-4_result.webp
822 ms
Capital-expenditure-software608.png
838 ms
04_result.webp
817 ms
api.min.js
138 ms
budgeted-versus-approved-capex-requests.webp
817 ms
cloud.png
828 ms
scalable.png
818 ms
pdata
86 ms
file.png
721 ms
coding.png
704 ms
easy.png
710 ms
flexibility.png
713 ms
response.png
726 ms
completed-task.png
698 ms
ptn-3_result.webp
657 ms
activity-log-items-1.png
688 ms
Capex-Request-View.webp
669 ms
Administration-Organizational.webp
669 ms
Closing-Capex-Custom-Field-New-Equipment.webp
686 ms
Budget-Overview-1.png
521 ms
account.png
451 ms
repair1.png
442 ms
study.png
398 ms
satisfaction.png
401 ms
capexplan-video-screen.png
388 ms
rocket2.png
384 ms
quiz.png
348 ms
slow.png
345 ms
standard.png
356 ms
unhealthy.png
356 ms
legal-document.png
311 ms
disadvantage.png
313 ms
Tracking-capital-expenditures.png
318 ms
capex-website-logo-white318.png
321 ms
itoi7ihmggk9jugklcqbhuf0aneydpau.js
120 ms
render.5ebf9a594610a33e649a.js
18 ms
capexplan.com accessibility score
Names and labels
These are opportunities to improve the semantics of the controls in your application. This may enhance the experience for users of assistive technology, like a screen reader.
Impact
Issue
Buttons do not have an accessible name
Links do not have a discernible name
Contrast
These are opportunities to improve the legibility of your content.
Impact
Issue
Background and foreground colors do not have a sufficient contrast ratio.
Navigation
These are opportunities to improve keyboard navigation in your application.
Impact
Issue
Heading elements are not in a sequentially-descending order
capexplan.com best practices score
Trust and Safety
Impact
Issue
Does not use HTTPS
Includes front-end JavaScript libraries with known security vulnerabilities
Ensure CSP is effective against XSS attacks
User Experience
Impact
Issue
Displays images with incorrect aspect ratio
Serves images with low resolution
General
Impact
Issue
Detected JavaScript libraries
Browser errors were logged to the console
Page has valid source maps
capexplan.com SEO score
Mobile Friendly
Make sure your pages are mobile friendly so users don’t have to pinch or zoom in order to read the content pages. [Learn more](https://developers.google.com/search/mobile-sites/).
Impact
Issue
Document uses legible font sizes
![]()
EN
![]()
EN
UTF-8
Language claimed in HTML meta tag should match the language actually used on the web page. Otherwise Capexplan.com can be misinterpreted by Google and other search engines. Our service has detected that English is used on the page, and it matches the claimed language. Our system also found out that Capexplan.com main page’s claimed encoding is utf-8. Use of this encoding format is the best practice as the main page visitors from all over the world won’t have any issues with symbol transcription.
capexplan.com
Open Graph data is detected on the main page of Capexplan. This is the best way to make the web page social media friendly. Here is how it looks like on Facebook: