Report Summary

  • 17

    Performance

    Renders faster than
    32% of other websites

  • 76

    Accessibility

    Visual factors better than
    that of 43% of websites

  • 75

    Best Practices

    More advanced features
    available than in
    36% of websites

  • 46

    SEO

    Google-friendlier than
    18% of websites

cellebrite.com

Cellebrite - Digital Intelligence For A Safer World

Page Load Speed

1.8 sec in total

First Response

78 ms

Resources Loaded

1 sec

Page Rendered

672 ms
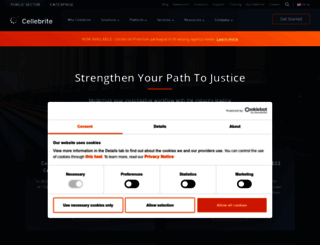
cellebrite.com screenshot

About Website

Click here to check amazing Cellebrite content for Brazil. Otherwise, check out these important facts you probably never knew about cellebrite.com

Cellebrite’s Digital Intelligence Suite of Solutions empowers law enforcement, governments, and enterprises to collect, review, analyze and manage digital data.

Visit cellebrite.com

Key Findings

We analyzed Cellebrite.com page load time and found that the first response time was 78 ms and then it took 1.7 sec to load all DOM resources and completely render a web page. This is quite a good result, as only 30% of websites can load faster.

Performance Metrics

cellebrite.com performance score

17

Measured Metrics

name

value

score

weighting

FCP (First Contentful Paint)

Value4.0 s

22/100

10%

LCP (Largest Contentful Paint)

Value24.2 s

0/100

25%

SI (Speed Index)

Value23.3 s

0/100

10%

TBT (Total Blocking Time)

Value49,480 ms

0/100

30%

CLS (Cumulative Layout Shift)

Value0.012

100/100

15%

TTI (Time to Interactive)

Value64.0 s

0/100

10%

Network Requests Diagram

cellebrite.com

78 ms

www.cellebrite.com

286 ms

lobby.css

18 ms

main-lobby.css

19 ms

swiper.min.css

18 ms

Our browser made a total of 72 requests to load all elements on the main page. We found that 69% of them (50 requests) were addressed to the original Cellebrite.com, 6% (4 requests) were made to Rtp-static.marketo.com and 4% (3 requests) were made to Google-analytics.com. The less responsive or slowest element that took the longest time to load (358 ms) belongs to the original domain Cellebrite.com.

Page Optimization Overview & Recommendations

Page size can be reduced by 824.5 kB (32%)

Content Size

2.6 MB

After Optimization

1.8 MB

In fact, the total size of Cellebrite.com main page is 2.6 MB. This result falls beyond the top 1M of websites and identifies a large and not optimized web page that may take ages to load. 75% of websites need less resources to load and that’s why Accessify’s recommendations for optimization and resource minification can be helpful for this project. Images take 1.6 MB which makes up the majority of the site volume.

HTML Optimization

-89%

Potential reduce by 60.2 kB

  • Original 67.7 kB
  • After minification 35.7 kB
  • After compression 7.6 kB

HTML content can be minified and compressed by a website’s server. The most efficient way is to compress content using GZIP which reduces data amount travelling through the network between server and browser. This page needs HTML code to be minified as it can gain 32.0 kB, which is 47% of the original size. It is highly recommended that content of this web page should be compressed using GZIP, as it can save up to 60.2 kB or 89% of the original size.

Image Optimization

-1%

Potential reduce by 19.2 kB

  • Original 1.6 MB
  • After minification 1.5 MB

Image size optimization can help to speed up a website loading time. The chart above shows the difference between the size before and after optimization. Cellebrite images are well optimized though.

JavaScript Optimization

-70%

Potential reduce by 417.7 kB

  • Original 598.3 kB
  • After minification 560.1 kB
  • After compression 180.6 kB

It’s better to minify JavaScript in order to improve website performance. The diagram shows the current total size of all JavaScript files against the prospective JavaScript size after its minification and compression. It is highly recommended that all JavaScript files should be compressed and minified as it can save up to 417.7 kB or 70% of the original size.

CSS Optimization

-87%

Potential reduce by 327.4 kB

  • Original 377.5 kB
  • After minification 307.1 kB
  • After compression 50.1 kB

CSS files minification is very important to reduce a web page rendering time. The faster CSS files can load, the earlier a page can be rendered. Cellebrite.com needs all CSS files to be minified and compressed as it can save up to 327.4 kB or 87% of the original size.

Requests Breakdown

Number of requests can be reduced by 33 (53%)

Requests Now

62

After Optimization

29

The browser has sent 62 CSS, Javascripts, AJAX and image requests in order to completely render the main page of Cellebrite. We recommend that multiple CSS and JavaScript files should be merged into one by each type, as it can help reduce assets requests from 21 to 1 for JavaScripts and from 14 to 1 for CSS and as a result speed up the page load time.

Accessibility Review

cellebrite.com accessibility score

76

Accessibility Issues

Contrast

These are opportunities to improve the legibility of your content.

Impact

Issue

High

Background and foreground colors do not have a sufficient contrast ratio.

Names and labels

These are opportunities to improve the semantics of the controls in your application. This may enhance the experience for users of assistive technology, like a screen reader.

Impact

Issue

High

Image elements do not have [alt] attributes

High

Links do not have a discernible name

Tables and lists

These are opportunities to improve the experience of reading tabular or list data using assistive technology, like a screen reader.

Impact

Issue

High

Lists do not contain only <li> elements and script supporting elements (<script> and <template>).

High

List items (<li>) are not contained within <ul> or <ol> parent elements.

Best Practices

cellebrite.com best practices score

75

Areas of Improvement

Trust and Safety

Impact

Issue

High

Does not use HTTPS

Low

Ensure CSP is effective against XSS attacks

General

Impact

Issue

Low

Detected JavaScript libraries

High

Browser errors were logged to the console

High

Issues were logged in the Issues panel in Chrome Devtools

SEO Factors

cellebrite.com SEO score

46

Search Engine Optimization Advices

Content Best Practices

Format your HTML in a way that enables crawlers to better understand your app’s content.

Impact

Issue

High

Links do not have descriptive text

High

Image elements do not have [alt] attributes

Crawling and Indexing

To appear in search results, crawlers need access to your app.

Impact

Issue

High

Links are not crawlable

Language and Encoding

  • Language Detected

    EN

  • Language Claimed

    EN

  • Encoding

    UTF-8

Language claimed in HTML meta tag should match the language actually used on the web page. Otherwise Cellebrite.com can be misinterpreted by Google and other search engines. Our service has detected that English is used on the page, and it matches the claimed language. Our system also found out that Cellebrite.com main page’s claimed encoding is utf-8. Use of this encoding format is the best practice as the main page visitors from all over the world won’t have any issues with symbol transcription.

Social Sharing Optimization

Open Graph description is not detected on the main page of Cellebrite. Lack of Open Graph description can be counter-productive for their social media presence, as such a description allows converting a website homepage (or other pages) into good-looking, rich and well-structured posts, when it is being shared on Facebook and other social media. For example, adding the following code snippet into HTML <head> tag will help to represent this web page correctly in social networks: