Report Summary

  • 9

    Performance

    Renders faster than
    23% of other websites

  • 100

    Accessibility

    Visual factors better than
    that of 97% of websites

  • 67

    Best Practices

    More advanced features
    available than in
    24% of websites

  • 91

    SEO

    Google-friendlier than
    71% of websites

citicards.com

Citi Credit Cards – Find the right Credit Card for you – Citi.com

Page Load Speed

46 sec in total

First Response

457 ms

Resources Loaded

37.9 sec

Page Rendered

7.6 sec
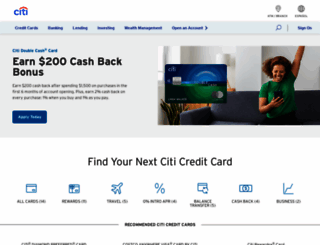
citicards.com screenshot

About Website

Visit citicards.com now to see the best up-to-date Citi Cards content for United States and also check out these interesting facts you probably never knew about citicards.com

Compare Citi credit card offers or login to your existing account. Explore a variety of features and benefits you can take advantage of as a Citi credit card member.

Visit citicards.com

Key Findings

We analyzed Citicards.com page load time and found that the first response time was 457 ms and then it took 45.5 sec to load all DOM resources and completely render a web page. This is an excellent result, as only a small number of websites can load faster.

Performance Metrics

citicards.com performance score

9

Measured Metrics

name

value

score

weighting

FCP (First Contentful Paint)

Value4.8 s

11/100

10%

LCP (Largest Contentful Paint)

Value29.4 s

0/100

25%

SI (Speed Index)

Value17.1 s

0/100

10%

TBT (Total Blocking Time)

Value17,650 ms

0/100

30%

CLS (Cumulative Layout Shift)

Value0.242

51/100

15%

TTI (Time to Interactive)

Value38.3 s

0/100

10%

Network Requests Diagram

citicards.com

457 ms

citi.action

666 ms

CitiCards_sass.css

414 ms

CitiCards_sass_res.css

1308 ms

jquery-1.7.2.js

1535 ms

Our browser made a total of 108 requests to load all elements on the main page. We found that 1% of them (1 request) were addressed to the original Citicards.com, 33% (36 requests) were made to Citi.com and 12% (13 requests) were made to Nexus.ensighten.com. The less responsive or slowest element that took the longest time to load (5.7 sec) relates to the external source A.rfihub.com.

Page Optimization Overview & Recommendations

Page size can be reduced by 4.4 MB (78%)

Content Size

5.6 MB

After Optimization

1.2 MB

In fact, the total size of Citicards.com main page is 5.6 MB. This result falls beyond the top 1M of websites and identifies a large and not optimized web page that may take ages to load. 75% of websites need less resources to load and that’s why Accessify’s recommendations for optimization and resource minification can be helpful for this project. Javascripts take 2.8 MB which makes up the majority of the site volume.

HTML Optimization

-85%

Potential reduce by 125.7 kB

  • Original 148.3 kB
  • After minification 125.4 kB
  • After compression 22.6 kB

HTML content can be minified and compressed by a website’s server. The most efficient way is to compress content using GZIP which reduces data amount travelling through the network between server and browser. This page needs HTML code to be minified as it can gain 22.9 kB, which is 15% of the original size. It is highly recommended that content of this web page should be compressed using GZIP, as it can save up to 125.7 kB or 85% of the original size.

Image Optimization

-9%

Potential reduce by 39.2 kB

  • Original 441.7 kB
  • After minification 402.5 kB

Image size optimization can help to speed up a website loading time. The chart above shows the difference between the size before and after optimization. Citi Cards images are well optimized though.

JavaScript Optimization

-79%

Potential reduce by 2.2 MB

  • Original 2.8 MB
  • After minification 2.5 MB
  • After compression 569.6 kB

It’s better to minify JavaScript in order to improve website performance. The diagram shows the current total size of all JavaScript files against the prospective JavaScript size after its minification and compression. It is highly recommended that all JavaScript files should be compressed and minified as it can save up to 2.2 MB or 79% of the original size.

CSS Optimization

-91%

Potential reduce by 2.0 MB

  • Original 2.2 MB
  • After minification 1.7 MB
  • After compression 208.0 kB

CSS files minification is very important to reduce a web page rendering time. The faster CSS files can load, the earlier a page can be rendered. Citicards.com needs all CSS files to be minified and compressed as it can save up to 2.0 MB or 91% of the original size.

Requests Breakdown

Number of requests can be reduced by 77 (75%)

Requests Now

103

After Optimization

26

The browser has sent 103 CSS, Javascripts, AJAX and image requests in order to completely render the main page of Citi Cards. We recommend that multiple CSS and JavaScript files should be merged into one by each type, as it can help reduce assets requests from 47 to 1 for JavaScripts and from 5 to 1 for CSS and as a result speed up the page load time.

Accessibility Review

citicards.com accessibility score

100

Accessibility Issues

Best Practices

citicards.com best practices score

67

Areas of Improvement

Trust and Safety

Impact

Issue

High

Does not use HTTPS

High

Includes front-end JavaScript libraries with known security vulnerabilities

Low

Ensure CSP is effective against XSS attacks

User Experience

Impact

Issue

High

Serves images with low resolution

General

Impact

Issue

Low

Detected JavaScript libraries

High

Browser errors were logged to the console

High

Missing source maps for large first-party JavaScript

SEO Factors

citicards.com SEO score

91

Search Engine Optimization Advices

Content Best Practices

Format your HTML in a way that enables crawlers to better understand your app’s content.

Impact

Issue

High

Links do not have descriptive text

Mobile Friendly

Make sure your pages are mobile friendly so users don’t have to pinch or zoom in order to read the content pages. [Learn more](https://developers.google.com/search/mobile-sites/).

Impact

Issue

High

Document uses legible font sizes

High

Tap targets are not sized appropriately

Language and Encoding

  • Language Detected

    EN

  • Language Claimed

    EN

  • Encoding

    ISO-8859-1

Language claimed in HTML meta tag should match the language actually used on the web page. Otherwise Citicards.com can be misinterpreted by Google and other search engines. Our service has detected that English is used on the page, and it matches the claimed language. Our system also found out that Citicards.com main page’s claimed encoding is iso-8859-1. Changing it to UTF-8 can be a good choice, as this format is commonly used for encoding all over the web and thus their visitors won’t have any troubles with symbol transcription or reading.

Social Sharing Optimization

Open Graph data is detected on the main page of Citi Cards. This is the best way to make the web page social media friendly. Here is how it looks like on Facebook: