Report Summary

  • 20

    Performance

    Renders faster than
    37% of other websites

  • 77

    Accessibility

    Visual factors better than
    that of 45% of websites

  • 75

    Best Practices

    More advanced features
    available than in
    36% of websites

  • 84

    SEO

    Google-friendlier than
    53% of websites

confluence.com

Investment Management Solutions - Confluence Technologies

Page Load Speed

2 sec in total

First Response

70 ms

Resources Loaded

1.8 sec

Page Rendered

192 ms
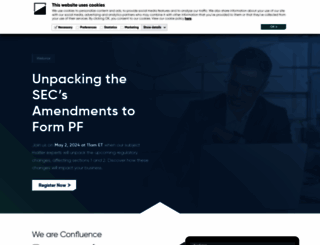
confluence.com screenshot

About Website

Welcome to confluence.com homepage info - get ready to check Confluence best content for United States right away, or after learning these important things about confluence.com

We are are a global leader in data-driven investment management solutions delivering products and services to optimize efficiency and control.

Visit confluence.com

Key Findings

We analyzed Confluence.com page load time and found that the first response time was 70 ms and then it took 1.9 sec to load all DOM resources and completely render a web page. This is quite a good result, as only 35% of websites can load faster.

Performance Metrics

confluence.com performance score

20

Measured Metrics

name

value

score

weighting

FCP (First Contentful Paint)

Value3.1 s

45/100

10%

LCP (Largest Contentful Paint)

Value18.1 s

0/100

25%

SI (Speed Index)

Value9.7 s

11/100

10%

TBT (Total Blocking Time)

Value2,440 ms

5/100

30%

CLS (Cumulative Layout Shift)

Value0.111

87/100

15%

TTI (Time to Interactive)

Value19.3 s

2/100

10%

Network Requests Diagram

confluence.com

70 ms

460 ms

reset.css

39 ms

default.css

65 ms

jquery.min.js

91 ms

Our browser made a total of 70 requests to load all elements on the main page. We found that 71% of them (50 requests) were addressed to the original Confluence.com, 3% (2 requests) were made to Wd-edge.sharethis.com and 3% (2 requests) were made to Cm.g.doubleclick.net. The less responsive or slowest element that took the longest time to load (460 ms) belongs to the original domain Confluence.com.

Page Optimization Overview & Recommendations

Page size can be reduced by 384.2 kB (18%)

Content Size

2.1 MB

After Optimization

1.8 MB

In fact, the total size of Confluence.com main page is 2.1 MB. This result falls beyond the top 1M of websites and identifies a large and not optimized web page that may take ages to load. 40% of websites need less resources to load. Images take 1.8 MB which makes up the majority of the site volume.

HTML Optimization

-88%

Potential reduce by 47.4 kB

  • Original 53.8 kB
  • After minification 33.3 kB
  • After compression 6.4 kB

HTML content can be minified and compressed by a website’s server. The most efficient way is to compress content using GZIP which reduces data amount travelling through the network between server and browser. This page needs HTML code to be minified as it can gain 20.5 kB, which is 38% of the original size. It is highly recommended that content of this web page should be compressed using GZIP, as it can save up to 47.4 kB or 88% of the original size.

Image Optimization

-8%

Potential reduce by 151.4 kB

  • Original 1.8 MB
  • After minification 1.7 MB

Image size optimization can help to speed up a website loading time. The chart above shows the difference between the size before and after optimization. Confluence images are well optimized though.

JavaScript Optimization

-69%

Potential reduce by 154.8 kB

  • Original 225.5 kB
  • After minification 220.6 kB
  • After compression 70.7 kB

It’s better to minify JavaScript in order to improve website performance. The diagram shows the current total size of all JavaScript files against the prospective JavaScript size after its minification and compression. It is highly recommended that all JavaScript files should be compressed and minified as it can save up to 154.8 kB or 69% of the original size.

CSS Optimization

-79%

Potential reduce by 30.7 kB

  • Original 38.8 kB
  • After minification 27.6 kB
  • After compression 8.1 kB

CSS files minification is very important to reduce a web page rendering time. The faster CSS files can load, the earlier a page can be rendered. Confluence.com needs all CSS files to be minified and compressed as it can save up to 30.7 kB or 79% of the original size.

Requests Breakdown

Number of requests can be reduced by 37 (58%)

Requests Now

64

After Optimization

27

The browser has sent 64 CSS, Javascripts, AJAX and image requests in order to completely render the main page of Confluence. We recommend that multiple CSS and JavaScript files should be merged into one by each type, as it can help reduce assets requests from 12 to 1 for JavaScripts and from 7 to 1 for CSS and as a result speed up the page load time.

Accessibility Review

confluence.com accessibility score

77

Accessibility Issues

Contrast

These are opportunities to improve the legibility of your content.

Impact

Issue

High

Background and foreground colors do not have a sufficient contrast ratio.

Navigation

These are opportunities to improve keyboard navigation in your application.

Impact

Issue

High

Heading elements are not in a sequentially-descending order

Names and labels

These are opportunities to improve the semantics of the controls in your application. This may enhance the experience for users of assistive technology, like a screen reader.

Impact

Issue

High

Image elements do not have [alt] attributes

High

Links do not have a discernible name

Tables and lists

These are opportunities to improve the experience of reading tabular or list data using assistive technology, like a screen reader.

Impact

Issue

High

Lists do not contain only <li> elements and script supporting elements (<script> and <template>).

High

List items (<li>) are not contained within <ul> or <ol> parent elements.

Best practices

These items highlight common accessibility best practices.

Impact

Issue

High

[user-scalable="no"] is used in the <meta name="viewport"> element or the [maximum-scale] attribute is less than 5.

Best Practices

confluence.com best practices score

75

Areas of Improvement

Trust and Safety

Impact

Issue

High

Does not use HTTPS

Low

Ensure CSP is effective against XSS attacks

User Experience

Impact

Issue

High

Displays images with incorrect aspect ratio

General

Impact

Issue

Low

Detected JavaScript libraries

High

Browser errors were logged to the console

High

Page has valid source maps

SEO Factors

confluence.com SEO score

84

Search Engine Optimization Advices

Content Best Practices

Format your HTML in a way that enables crawlers to better understand your app’s content.

Impact

Issue

High

Links do not have descriptive text

High

Image elements do not have [alt] attributes

Mobile Friendly

Make sure your pages are mobile friendly so users don’t have to pinch or zoom in order to read the content pages. [Learn more](https://developers.google.com/search/mobile-sites/).

Impact

Issue

High

Document uses legible font sizes

High

Tap targets are not sized appropriately

Language and Encoding

  • Language Detected

    EN

  • Language Claimed

    EN

  • Encoding

    UTF-8

Language claimed in HTML meta tag should match the language actually used on the web page. Otherwise Confluence.com can be misinterpreted by Google and other search engines. Our service has detected that English is used on the page, and it matches the claimed language. Our system also found out that Confluence.com main page’s claimed encoding is utf-8. Use of this encoding format is the best practice as the main page visitors from all over the world won’t have any issues with symbol transcription.

Social Sharing Optimization

Open Graph data is detected on the main page of Confluence. This is the best way to make the web page social media friendly. Here is how it looks like on Facebook: