Report Summary

  • 0

    Performance

  • 0

    Accessibility

  • 0

    Best Practices

  • 0

    SEO

connectionpower.com

Connection Power Replacement | Fellowship One Church Software

Page Load Speed

3.1 sec in total

First Response

217 ms

Resources Loaded

2.7 sec

Page Rendered

181 ms
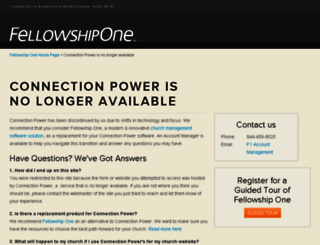
connectionpower.com screenshot

About Website

Visit connectionpower.com now to see the best up-to-date Connection Power content and also check out these interesting facts you probably never knew about connectionpower.com

Connection Power has been discontinued by us due to shifts in technology and focus. We recommend that you consider Fellowship One, a modern & innovative church management solution, as a replacement fo...

Visit connectionpower.com

Key Findings

We analyzed Connectionpower.com page load time and found that the first response time was 217 ms and then it took 2.9 sec to load all DOM resources and completely render a web page. This is a poor result, as 50% of websites can load faster.

Performance Metrics

connectionpower.com performance score

0

Network Requests Diagram

connectionpower.com

217 ms

connection-power-eol

474 ms

ip-utilities.js

430 ms

b2b-bootstrap.css

153 ms

activefaith-scaffolding.css

153 ms

Our browser made a total of 98 requests to load all elements on the main page. We found that 1% of them (1 request) were addressed to the original Connectionpower.com, 43% (42 requests) were made to Fellowshipone.com and 8% (8 requests) were made to D.adroll.com. The less responsive or slowest element that took the longest time to load (618 ms) relates to the external source Fellowshipone.com.

Page Optimization Overview & Recommendations

Page size can be reduced by 502.7 kB (68%)

Content Size

743.4 kB

After Optimization

240.7 kB

In fact, the total size of Connectionpower.com main page is 743.4 kB. This result falls beyond the top 1M of websites and identifies a large and not optimized web page that may take ages to load. 45% of websites need less resources to load. Javascripts take 393.4 kB which makes up the majority of the site volume.

HTML Optimization

-75%

Potential reduce by 14.6 kB

  • Original 19.4 kB
  • After minification 16.3 kB
  • After compression 4.8 kB

HTML content can be minified and compressed by a website’s server. The most efficient way is to compress content using GZIP which reduces data amount travelling through the network between server and browser. This page needs HTML code to be minified as it can gain 3.1 kB, which is 16% of the original size. It is highly recommended that content of this web page should be compressed using GZIP, as it can save up to 14.6 kB or 75% of the original size.

Image Optimization

-36%

Potential reduce by 2.2 kB

  • Original 6.0 kB
  • After minification 3.8 kB

Image size optimization can help to speed up a website loading time. The chart above shows the difference between the size before and after optimization. Obviously, Connection Power needs image optimization as it can save up to 2.2 kB or 36% of the original volume. The most popular and efficient tools for JPEG and PNG image optimization are Jpegoptim and PNG Crush.

JavaScript Optimization

-53%

Potential reduce by 208.2 kB

  • Original 393.4 kB
  • After minification 362.9 kB
  • After compression 185.2 kB

It’s better to minify JavaScript in order to improve website performance. The diagram shows the current total size of all JavaScript files against the prospective JavaScript size after its minification and compression. It is highly recommended that all JavaScript files should be compressed and minified as it can save up to 208.2 kB or 53% of the original size.

CSS Optimization

-86%

Potential reduce by 277.6 kB

  • Original 324.5 kB
  • After minification 301.6 kB
  • After compression 46.9 kB

CSS files minification is very important to reduce a web page rendering time. The faster CSS files can load, the earlier a page can be rendered. Connectionpower.com needs all CSS files to be minified and compressed as it can save up to 277.6 kB or 86% of the original size.

Requests Breakdown

Number of requests can be reduced by 51 (86%)

Requests Now

59

After Optimization

8

The browser has sent 59 CSS, Javascripts, AJAX and image requests in order to completely render the main page of Connection Power. We recommend that multiple CSS and JavaScript files should be merged into one by each type, as it can help reduce assets requests from 33 to 1 for JavaScripts and from 4 to 1 for CSS and as a result speed up the page load time.

SEO Factors

connectionpower.com SEO score

0

Language and Encoding

  • Language Detected

    EN

  • Language Claimed

    N/A

  • Encoding

    UTF-8

Language claimed in HTML meta tag should match the language actually used on the web page. Otherwise Connectionpower.com can be misinterpreted by Google and other search engines. Our service has detected that English is used on the page, and neither this language nor any other was claimed in <html> or <meta> tags. Our system also found out that Connectionpower.com main page’s claimed encoding is utf-8. Use of this encoding format is the best practice as the main page visitors from all over the world won’t have any issues with symbol transcription.

Social Sharing Optimization

Open Graph description is not detected on the main page of Connection Power. Lack of Open Graph description can be counter-productive for their social media presence, as such a description allows converting a website homepage (or other pages) into good-looking, rich and well-structured posts, when it is being shared on Facebook and other social media. For example, adding the following code snippet into HTML <head> tag will help to represent this web page correctly in social networks: