Report Summary

  • 0

    Performance

  • 33

    Accessibility

    Visual factors better than
    that of 18% of websites

  • 75

    Best Practices

    More advanced features
    available than in
    36% of websites

  • 73

    SEO

    Google-friendlier than
    31% of websites

cupressus.net

Cupressus Conservation Project - Arboretum de Villardebelle
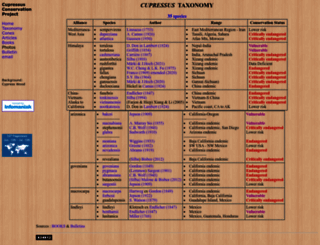
Page Load Speed

1.4 sec in total

First Response

308 ms

Resources Loaded

872 ms

Page Rendered

178 ms

cupressus.net screenshot

About Website

Welcome to cupressus.net homepage info - get ready to check Cupressus best content right away, or after learning these important things about cupressus.net

Cupressus Conservation Project. This Conservation Project aims at planting groves of endangered species of Cupressus, namely Cupressus stephensonii, Cupressus atlantica and Cupressus dupreziana. Other...

Visit cupressus.net

Key Findings

We analyzed Cupressus.net page load time and found that the first response time was 308 ms and then it took 1.1 sec to load all DOM resources and completely render a web page. This is quite a good result, as only 20% of websites can load faster.

Performance Metrics

cupressus.net performance score

0

Measured Metrics

name

value

score

weighting

FCP (First Contentful Paint)

Value2.5 s

68/100

10%

LCP (Largest Contentful Paint)

Value0

0/100

25%

SI (Speed Index)

Value2.5 s

97/100

10%

TBT (Total Blocking Time)

Value70 ms

99/100

30%

CLS (Cumulative Layout Shift)

Value0

100/100

15%

TTI (Time to Interactive)

Value3.2 s

94/100

10%

Network Requests Diagram

cupressus.net

308 ms

cup1t.html

96 ms

cupressus.html

189 ms

map_v2.js

44 ms

Cypress_small.gif

95 ms

Our browser made a total of 12 requests to load all elements on the main page. We found that 42% of them (5 requests) were addressed to the original Cupressus.net, 33% (4 requests) were made to Clustrmaps.com and 8% (1 request) were made to Cdn.clustrmaps.com. The less responsive or slowest element that took the longest time to load (370 ms) relates to the external source Imu411.infomaniak.ch.

Page Optimization Overview & Recommendations

Page size can be reduced by 7.8 kB (31%)

Content Size

25.2 kB

After Optimization

17.3 kB

In fact, the total size of Cupressus.net main page is 25.2 kB. This result falls beyond the top 1M of websites and identifies a large and not optimized web page that may take ages to load. Only 10% of websites need less resources to load. Images take 24.4 kB which makes up the majority of the site volume.

HTML Optimization

-50%

Potential reduce by 405 B

  • Original 804 B
  • After minification 804 B
  • After compression 399 B

HTML content can be minified and compressed by a website’s server. The most efficient way is to compress content using GZIP which reduces data amount travelling through the network between server and browser. HTML code on this page is well minified. It is highly recommended that content of this web page should be compressed using GZIP, as it can save up to 405 B or 50% of the original size.

Image Optimization

-30%

Potential reduce by 7.4 kB

  • Original 24.4 kB
  • After minification 16.9 kB

Image size optimization can help to speed up a website loading time. The chart above shows the difference between the size before and after optimization. Obviously, Cupressus needs image optimization as it can save up to 7.4 kB or 30% of the original volume. The most popular and efficient tools for JPEG and PNG image optimization are Jpegoptim and PNG Crush.

Requests Breakdown

We found no issues to fix!

Requests Now

10

After Optimization

10

The browser has sent 10 CSS, Javascripts, AJAX and image requests in order to completely render the main page of Cupressus. According to our analytics all requests are already optimized.

Accessibility Review

cupressus.net accessibility score

33

Accessibility Issues

Names and labels

These are opportunities to improve the semantics of the controls in your application. This may enhance the experience for users of assistive technology, like a screen reader.

Impact

Issue

High

<frame> or <iframe> elements do not have a title

Internationalization and localization

These are opportunities to improve the interpretation of your content by users in different locales.

Impact

Issue

High

<html> element does not have a [lang] attribute

Best Practices

cupressus.net best practices score

75

Areas of Improvement

Trust and Safety

Impact

Issue

High

Does not use HTTPS

Low

Ensure CSP is effective against XSS attacks

SEO Factors

cupressus.net SEO score

73

Search Engine Optimization Advices

Language and Encoding

  • Language Detected

    EN

  • Language Claimed

    N/A

  • Encoding

    N/A

Language claimed in HTML meta tag should match the language actually used on the web page. Otherwise Cupressus.net can be misinterpreted by Google and other search engines. Our service has detected that English is used on the page, and neither this language nor any other was claimed in <html> or <meta> tags. Our system also found out that Cupressus.net main page’s claimed encoding is . Changing it to UTF-8 can be a good choice, as this format is commonly used for encoding all over the web and thus their visitors won’t have any troubles with symbol transcription or reading.

Social Sharing Optimization

Open Graph description is not detected on the main page of Cupressus. Lack of Open Graph description can be counter-productive for their social media presence, as such a description allows converting a website homepage (or other pages) into good-looking, rich and well-structured posts, when it is being shared on Facebook and other social media. For example, adding the following code snippet into HTML <head> tag will help to represent this web page correctly in social networks: