material-dashboard-laravel.creative-tim.com
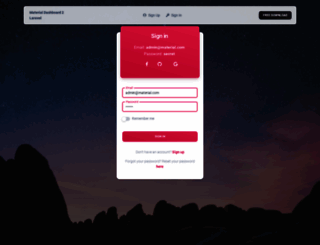
Material Dashboard 2 by Creative Tim & UPDIVISION
Page Load Speed
1.4 sec in total
First Response
225 ms
Resources Loaded
967 ms
Page Rendered
218 ms
About Website
Visit material-dashboard-laravel.creative-tim.com now to see the best up-to-date Material Dashboard Laravel Creative Tim content for India and also check out these interesting facts you probably never knew about material-dashboard-laravel.creative-tim.com
A free Laravel Dashboard featuring dozens of UI components & basic Laravel CRUDs.
Visit material-dashboard-laravel.creative-tim.comKey Findings
We analyzed Material-dashboard-laravel.creative-tim.com page load time and found that the first response time was 225 ms and then it took 1.2 sec to load all DOM resources and completely render a web page. This is quite a good result, as only 20% of websites can load faster.