Report Summary

  • 40

    Performance

    Renders faster than
    60% of other websites

  • 87

    Accessibility

    Visual factors better than
    that of 67% of websites

  • 75

    Best Practices

    More advanced features
    available than in
    36% of websites

  • 83

    SEO

    Google-friendlier than
    46% of websites

datalore.io

JetBrains Datalore: A powerful environment for Jupyter notebooks.

Page Load Speed

518 ms in total

First Response

145 ms

Resources Loaded

299 ms

Page Rendered

74 ms

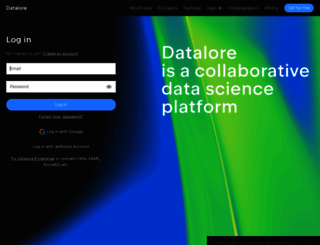
datalore.io screenshot

About Website

Visit datalore.io now to see the best up-to-date Datalore content for United States and also check out these interesting facts you probably never knew about datalore.io

Use smart coding assistance for Python, SQL, R and Scala in Jupyter notebooks, run code on powerful CPUs and GPUs, collaborate with your team, and easily share the results.

Visit datalore.io

Key Findings

We analyzed Datalore.io page load time and found that the first response time was 145 ms and then it took 373 ms to load all DOM resources and completely render a web page. This is an excellent result, as only 5% of websites can load faster.

Performance Metrics

datalore.io performance score

40

Measured Metrics

name

value

score

weighting

FCP (First Contentful Paint)

Value3.6 s

33/100

10%

LCP (Largest Contentful Paint)

Value3.8 s

55/100

25%

SI (Speed Index)

Value6.6 s

37/100

10%

TBT (Total Blocking Time)

Value1,810 ms

9/100

30%

CLS (Cumulative Layout Shift)

Value0

100/100

15%

TTI (Time to Interactive)

Value12.5 s

14/100

10%

Network Requests Diagram

datalore.io

145 ms

datalore.jetbrains.com

142 ms

Our browser made a total of 2 requests to load all elements on the main page. We found that 50% of them (1 request) were addressed to the original Datalore.io, 50% (1 request) were made to Datalore.jetbrains.com. The less responsive or slowest element that took the longest time to load (145 ms) belongs to the original domain Datalore.io.

Page Optimization Overview & Recommendations

Page size can be reduced by 54 B (35%)

Content Size

156 B

After Optimization

102 B

In fact, the total size of Datalore.io main page is 156 B. This result falls within the top 5000 of lightweight and thus fast loading web pages. Only a small number of websites need less resources to load. HTML takes 156 B which makes up the majority of the site volume.

HTML Optimization

-35%

Potential reduce by 54 B

  • Original 156 B
  • After minification 154 B
  • After compression 102 B

HTML content can be minified and compressed by a website’s server. The most efficient way is to compress content using GZIP which reduces data amount travelling through the network between server and browser. HTML code on this page is well minified. It is highly recommended that content of this web page should be compressed using GZIP, as it can save up to 54 B or 35% of the original size.

Requests Breakdown

We found no issues to fix!

Requests Now

0

After Optimization

0

Besides the initial HTML request, no CSS, Javascripts, AJAX or image files were requested in the course of web page rendering.

Accessibility Review

datalore.io accessibility score

87

Accessibility Issues

Contrast

These are opportunities to improve the legibility of your content.

Impact

Issue

High

Background and foreground colors do not have a sufficient contrast ratio.

Best practices

These items highlight common accessibility best practices.

Impact

Issue

High

[user-scalable="no"] is used in the <meta name="viewport"> element or the [maximum-scale] attribute is less than 5.

Best Practices

datalore.io best practices score

75

Areas of Improvement

Trust and Safety

Impact

Issue

High

Does not use HTTPS

Low

Ensure CSP is effective against XSS attacks

User Experience

Impact

Issue

High

Displays images with incorrect aspect ratio

High

Serves images with low resolution

General

Impact

Issue

Low

Detected JavaScript libraries

High

Missing source maps for large first-party JavaScript

SEO Factors

datalore.io SEO score

83

Search Engine Optimization Advices

Content Best Practices

Format your HTML in a way that enables crawlers to better understand your app’s content.

Impact

Issue

High

Links do not have descriptive text

Crawling and Indexing

To appear in search results, crawlers need access to your app.

Impact

Issue

High

Links are not crawlable

Mobile Friendly

Make sure your pages are mobile friendly so users don’t have to pinch or zoom in order to read the content pages. [Learn more](https://developers.google.com/search/mobile-sites/).

Impact

Issue

High

Document uses legible font sizes

Language and Encoding

  • Language Detected

    EN

  • Language Claimed

    N/A

  • Encoding

    N/A

Language claimed in HTML meta tag should match the language actually used on the web page. Otherwise Datalore.io can be misinterpreted by Google and other search engines. Our service has detected that English is used on the page, and neither this language nor any other was claimed in <html> or <meta> tags. Our system also found out that Datalore.io main page’s claimed encoding is . Changing it to UTF-8 can be a good choice, as this format is commonly used for encoding all over the web and thus their visitors won’t have any troubles with symbol transcription or reading.

Social Sharing Optimization

Open Graph description is not detected on the main page of Datalore. Lack of Open Graph description can be counter-productive for their social media presence, as such a description allows converting a website homepage (or other pages) into good-looking, rich and well-structured posts, when it is being shared on Facebook and other social media. For example, adding the following code snippet into HTML <head> tag will help to represent this web page correctly in social networks: