Report Summary

  • 91

    Performance

    Renders faster than
    91% of other websites

  • 88

    Accessibility

    Visual factors better than
    that of 68% of websites

  • 92

    Best Practices

    More advanced features
    available than in
    80% of websites

  • 98

    SEO

    Google-friendlier than
    92% of websites

davinci.pl

Instalacje fotowoltaiczne dla firm | Da Vinci Green Energy

Page Load Speed

4 sec in total

First Response

336 ms

Resources Loaded

2.7 sec

Page Rendered

872 ms

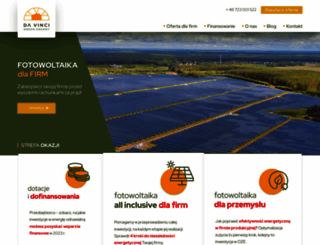
davinci.pl screenshot

About Website

Welcome to davinci.pl homepage info - get ready to check Da Vinci best content right away, or after learning these important things about davinci.pl

Nowoczesne, ekonomiczne i bezpieczne rozwiązania OZE dla firm ⭐ Instalacje fotowoltaiczne, wiaty fotowoltaiczne, magazyny energii.

Visit davinci.pl

Key Findings

We analyzed Davinci.pl page load time and found that the first response time was 336 ms and then it took 3.6 sec to load all DOM resources and completely render a web page. This is a poor result, as 60% of websites can load faster.

Performance Metrics

davinci.pl performance score

91

Measured Metrics

name

value

score

weighting

FCP (First Contentful Paint)

Value2.7 s

60/100

10%

LCP (Largest Contentful Paint)

Value2.7 s

85/100

25%

SI (Speed Index)

Value3.6 s

87/100

10%

TBT (Total Blocking Time)

Value0 ms

100/100

30%

CLS (Cumulative Layout Shift)

Value0.001

100/100

15%

TTI (Time to Interactive)

Value2.7 s

97/100

10%

Network Requests Diagram

davinci.pl

336 ms

davinci.pl

652 ms

css2

37 ms

owl.carousel.min.css

114 ms

style.min.css

230 ms

Our browser made a total of 35 requests to load all elements on the main page. We found that 89% of them (31 requests) were addressed to the original Davinci.pl, 9% (3 requests) were made to Fonts.gstatic.com and 3% (1 request) were made to Fonts.googleapis.com. The less responsive or slowest element that took the longest time to load (1.2 sec) belongs to the original domain Davinci.pl.

Page Optimization Overview & Recommendations

Page size can be reduced by 614.9 kB (13%)

Content Size

4.7 MB

After Optimization

4.0 MB

In fact, the total size of Davinci.pl main page is 4.7 MB. This result falls beyond the top 1M of websites and identifies a large and not optimized web page that may take ages to load. 30% of websites need less resources to load. Images take 4.6 MB which makes up the majority of the site volume.

HTML Optimization

-81%

Potential reduce by 79.4 kB

  • Original 98.7 kB
  • After minification 89.1 kB
  • After compression 19.2 kB

HTML content can be minified and compressed by a website’s server. The most efficient way is to compress content using GZIP which reduces data amount travelling through the network between server and browser. HTML code on this page is well minified. It is highly recommended that content of this web page should be compressed using GZIP, as it can save up to 79.4 kB or 81% of the original size.

Image Optimization

-12%

Potential reduce by 535.4 kB

  • Original 4.6 MB
  • After minification 4.0 MB

Image size optimization can help to speed up a website loading time. The chart above shows the difference between the size before and after optimization. Obviously, Da Vinci needs image optimization as it can save up to 535.4 kB or 12% of the original volume. The most popular and efficient tools for JPEG and PNG image optimization are Jpegoptim and PNG Crush.

Requests Breakdown

Number of requests can be reduced by 12 (40%)

Requests Now

30

After Optimization

18

The browser has sent 30 CSS, Javascripts, AJAX and image requests in order to completely render the main page of Da Vinci. We recommend that multiple CSS and JavaScript files should be merged into one by each type, as it can help reduce assets requests from 8 to 1 for CSS and as a result speed up the page load time.

Accessibility Review

davinci.pl accessibility score

88

Accessibility Issues

Contrast

These are opportunities to improve the legibility of your content.

Impact

Issue

High

Background and foreground colors do not have a sufficient contrast ratio.

Navigation

These are opportunities to improve keyboard navigation in your application.

Impact

Issue

High

Heading elements are not in a sequentially-descending order

Names and labels

These are opportunities to improve the semantics of the controls in your application. This may enhance the experience for users of assistive technology, like a screen reader.

Impact

Issue

High

Form elements do not have associated labels

High

Links do not have a discernible name

Best Practices

davinci.pl best practices score

92

Areas of Improvement

Trust and Safety

Impact

Issue

High

Does not use HTTPS

Low

Ensure CSP is effective against XSS attacks

General

Impact

Issue

Low

Detected JavaScript libraries

SEO Factors

davinci.pl SEO score

98

Search Engine Optimization Advices

Mobile Friendly

Make sure your pages are mobile friendly so users don’t have to pinch or zoom in order to read the content pages. [Learn more](https://developers.google.com/search/mobile-sites/).

Impact

Issue

High

Document uses legible font sizes

High

Tap targets are not sized appropriately

Language and Encoding

  • Language Detected

    PL

  • Language Claimed

    PL

  • Encoding

    UTF-8

Language claimed in HTML meta tag should match the language actually used on the web page. Otherwise Davinci.pl can be misinterpreted by Google and other search engines. Our service has detected that Polish is used on the page, and it matches the claimed language. Our system also found out that Davinci.pl main page’s claimed encoding is utf-8. Use of this encoding format is the best practice as the main page visitors from all over the world won’t have any issues with symbol transcription.

Social Sharing Optimization

Open Graph data is detected on the main page of Da Vinci. This is the best way to make the web page social media friendly. Here is how it looks like on Facebook: