Report Summary

  • 0

    Performance

  • 0

    Accessibility

  • 0

    Best Practices

  • 0

    SEO

Page Load Speed

5.8 sec in total

First Response

835 ms

Resources Loaded

2 sec

Page Rendered

2.9 sec

destinationadventure.in screenshot

About Website

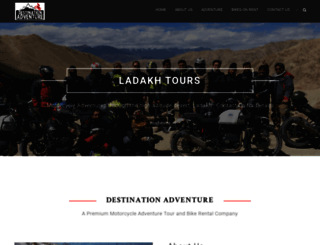
Visit destinationadventure.in now to see the best up-to-date Destinationadventure content and also check out these interesting facts you probably never knew about destinationadventure.in

Motorcycle Adventure and Bike rental in Siliguri, Bagdogra catering to Bhutan, Nepal, Sikkim, North East India and Darjeeling Hills. Royal Enfield bikes on hire

Visit destinationadventure.in

Key Findings

We analyzed Destinationadventure.in page load time and found that the first response time was 835 ms and then it took 4.9 sec to load all DOM resources and completely render a web page. This is a poor result, as 70% of websites can load faster.

Performance Metrics

destinationadventure.in performance score

0

Network Requests Diagram

destinationadventure.in

835 ms

wp-emoji-release.min.js

59 ms

simply-instagram.css

114 ms

simply-instagram-prettyPhoto.css

116 ms

tooltipster.css

117 ms

Our browser made a total of 82 requests to load all elements on the main page. We found that 74% of them (61 requests) were addressed to the original Destinationadventure.in, 6% (5 requests) were made to Fonts.gstatic.com and 6% (5 requests) were made to Gstatic.com. The less responsive or slowest element that took the longest time to load (835 ms) belongs to the original domain Destinationadventure.in.

Page Optimization Overview & Recommendations

Page size can be reduced by 248.5 kB (7%)

Content Size

3.5 MB

After Optimization

3.3 MB

In fact, the total size of Destinationadventure.in main page is 3.5 MB. This result falls beyond the top 1M of websites and identifies a large and not optimized web page that may take ages to load. 80% of websites need less resources to load and that’s why Accessify’s recommendations for optimization and resource minification can be helpful for this project. Images take 3.4 MB which makes up the majority of the site volume.

HTML Optimization

-83%

Potential reduce by 61.4 kB

  • Original 74.1 kB
  • After minification 62.9 kB
  • After compression 12.6 kB

HTML content can be minified and compressed by a website’s server. The most efficient way is to compress content using GZIP which reduces data amount travelling through the network between server and browser. This page needs HTML code to be minified as it can gain 11.2 kB, which is 15% of the original size. It is highly recommended that content of this web page should be compressed using GZIP, as it can save up to 61.4 kB or 83% of the original size.

Image Optimization

-5%

Potential reduce by 185.7 kB

  • Original 3.4 MB
  • After minification 3.2 MB

Image size optimization can help to speed up a website loading time. The chart above shows the difference between the size before and after optimization. Destinationadventure images are well optimized though.

JavaScript Optimization

-6%

Potential reduce by 1.4 kB

  • Original 23.2 kB
  • After minification 23.1 kB
  • After compression 21.8 kB

It’s better to minify JavaScript in order to improve website performance. The diagram shows the current total size of all JavaScript files against the prospective JavaScript size after its minification and compression. This website has mostly compressed JavaScripts.

CSS Optimization

-0%

Potential reduce by 14 B

  • Original 35.2 kB
  • After minification 35.2 kB
  • After compression 35.2 kB

CSS files minification is very important to reduce a web page rendering time. The faster CSS files can load, the earlier a page can be rendered. Destinationadventure.in has all CSS files already compressed.

Requests Breakdown

Number of requests can be reduced by 45 (60%)

Requests Now

75

After Optimization

30

The browser has sent 75 CSS, Javascripts, AJAX and image requests in order to completely render the main page of Destinationadventure. We recommend that multiple CSS and JavaScript files should be merged into one by each type, as it can help reduce assets requests from 33 to 1 for JavaScripts and from 14 to 1 for CSS and as a result speed up the page load time.

SEO Factors

destinationadventure.in SEO score

0

Language and Encoding

  • Language Detected

    EN

  • Language Claimed

    EN

  • Encoding

    UTF-8

Language claimed in HTML meta tag should match the language actually used on the web page. Otherwise Destinationadventure.in can be misinterpreted by Google and other search engines. Our service has detected that English is used on the page, and it matches the claimed language. Our system also found out that Destinationadventure.in main page’s claimed encoding is utf-8. Use of this encoding format is the best practice as the main page visitors from all over the world won’t have any issues with symbol transcription.

Social Sharing Optimization

Open Graph description is not detected on the main page of Destinationadventure. Lack of Open Graph description can be counter-productive for their social media presence, as such a description allows converting a website homepage (or other pages) into good-looking, rich and well-structured posts, when it is being shared on Facebook and other social media. For example, adding the following code snippet into HTML <head> tag will help to represent this web page correctly in social networks: