1.7 sec in total
118 ms
1.4 sec
238 ms
Visit dfarber.com now to see the best up-to-date Dfarber content for India and also check out these interesting facts you probably never knew about dfarber.com
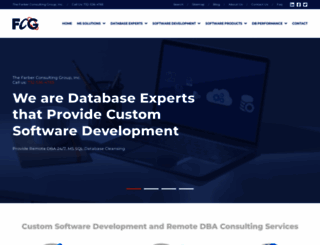
The Farber Consulting Group is a Software Development Company offering custom software development, DBA consulting & remote DBA services. Contact us today!
Visit dfarber.comWe analyzed Dfarber.com page load time and found that the first response time was 118 ms and then it took 1.6 sec to load all DOM resources and completely render a web page. This is quite a good result, as only 35% of websites can load faster.
dfarber.com performance score
name
value
score
weighting
Value3.4 s
37/100
10%
Value6.2 s
11/100
25%
Value6.1 s
45/100
10%
Value2,170 ms
6/100
30%
Value0.263
47/100
15%
Value14.7 s
8/100
10%
118 ms
79 ms
59 ms
50 ms
44 ms
Our browser made a total of 75 requests to load all elements on the main page. We found that 88% of them (66 requests) were addressed to the original Dfarber.com, 3% (2 requests) were made to Google-analytics.com and 3% (2 requests) were made to S.ytimg.com. The less responsive or slowest element that took the longest time to load (787 ms) belongs to the original domain Dfarber.com.
Page size can be reduced by 787.1 kB (67%)
1.2 MB
388.0 kB
In fact, the total size of Dfarber.com main page is 1.2 MB. This result falls beyond the top 1M of websites and identifies a large and not optimized web page that may take ages to load. 35% of websites need less resources to load. Javascripts take 687.2 kB which makes up the majority of the site volume.
Potential reduce by 38.2 kB
HTML content can be minified and compressed by a website’s server. The most efficient way is to compress content using GZIP which reduces data amount travelling through the network between server and browser. HTML code on this page is well minified. It is highly recommended that content of this web page should be compressed using GZIP, as it can save up to 38.2 kB or 80% of the original size.
Potential reduce by 39.7 kB
Image size optimization can help to speed up a website loading time. The chart above shows the difference between the size before and after optimization. Obviously, Dfarber needs image optimization as it can save up to 39.7 kB or 23% of the original volume. The most popular and efficient tools for JPEG and PNG image optimization are Jpegoptim and PNG Crush.
Potential reduce by 487.9 kB
It’s better to minify JavaScript in order to improve website performance. The diagram shows the current total size of all JavaScript files against the prospective JavaScript size after its minification and compression. It is highly recommended that all JavaScript files should be compressed and minified as it can save up to 487.9 kB or 71% of the original size.
Potential reduce by 221.2 kB
CSS files minification is very important to reduce a web page rendering time. The faster CSS files can load, the earlier a page can be rendered. Dfarber.com needs all CSS files to be minified and compressed as it can save up to 221.2 kB or 83% of the original size.
Number of requests can be reduced by 45 (63%)
72
27
The browser has sent 72 CSS, Javascripts, AJAX and image requests in order to completely render the main page of Dfarber. We recommend that multiple CSS and JavaScript files should be merged into one by each type, as it can help reduce assets requests from 42 to 1 for JavaScripts and from 5 to 1 for CSS and as a result speed up the page load time.
www.dfarber.com
118 ms
Common.css
79 ms
Home.css
59 ms
FCG.js
50 ms
simpleCookiesWork.js
44 ms
jquery.js
158 ms
jquery.flash.js
80 ms
flashobject.js
85 ms
swfobject.js
88 ms
shCore.js
117 ms
shBrushJScript.js
761 ms
shBrushAS3.js
104 ms
shBrushBash.js
107 ms
shBrushColdFusion.js
116 ms
shBrushCpp.js
125 ms
shBrushCSharp.js
124 ms
shBrushCss.js
139 ms
shBrushDelphi.js
138 ms
shBrushDiff.js
142 ms
shBrushErlang.js
145 ms
shBrushGroovy.js
178 ms
shBrushJava.js
178 ms
shBrushJavaFX.js
178 ms
shBrushPerl.js
178 ms
shBrushPhp.js
787 ms
shBrushPlain.js
178 ms
shBrushPowerShell.js
179 ms
shBrushPython.js
178 ms
shBrushRuby.js
185 ms
shBrushSass.js
192 ms
shBrushScala.js
197 ms
shBrushSql.js
691 ms
shBrushVb.js
205 ms
shBrushXml.js
209 ms
shCore.css
244 ms
shThemeDefault.css
246 ms
flashIntegration.js
244 ms
jquery.placeholder.min.js
229 ms
HomePage.js
232 ms
WebResource.axd
222 ms
ScriptResource.axd
214 ms
ScriptResource.axd
224 ms
ScriptResource.axd
226 ms
mainBg.png
228 ms
ga.js
32 ms
globalBrandingBg.png
57 ms
footerBg998px.png
30 ms
FarberSmallLogo.png
55 ms
Twitter.png
29 ms
Facebook.png
54 ms
blog_icon.gif
26 ms
sitemapIcon.png
63 ms
contactIcon.png
63 ms
homeIcon_Over.png
62 ms
Logo_with_shadow.png
76 ms
image001.png
80 ms
CaptchaImage.axd
69 ms
custom-software-development.png
85 ms
ms-sql-server.jpg
84 ms
convert-access-to-web.png
82 ms
ms-sql-remote-dba-and-web-site-database-applications.gif
141 ms
remote-dba-services.gif
106 ms
menuBG.jpg
102 ms
image1Farber.jpg
126 ms
jLfMD8khcxU
130 ms
SpotListBorder.png
88 ms
discGray.png
95 ms
__utm.gif
31 ms
homeContentFooterBg.png
82 ms
www-embed-player-vflZsBgOl.css
66 ms
www-embed-player.js
88 ms
6BOEML_YqI6cKINK5dmh8ZufcXg7sBa4jeB-I9gQ0xI.js
26 ms
ad_status.js
33 ms
zN7GBFwfMP4uA6AR0HCoLQ.ttf
67 ms
RxZJdnzeo3R5zSexge8UUaCWcynf_cDxXwCLxiixG1c.ttf
74 ms
dfarber.com accessibility score
Contrast
These are opportunities to improve the legibility of your content.
Impact
Issue
Background and foreground colors do not have a sufficient contrast ratio.
Names and labels
These are opportunities to improve the semantics of the controls in your application. This may enhance the experience for users of assistive technology, like a screen reader.
Impact
Issue
<frame> or <iframe> elements do not have a title
Image elements do not have [alt] attributes
Links do not have a discernible name
Navigation
These are opportunities to improve keyboard navigation in your application.
Impact
Issue
Heading elements are not in a sequentially-descending order
dfarber.com best practices score
Trust and Safety
Impact
Issue
Does not use HTTPS
Includes front-end JavaScript libraries with known security vulnerabilities
Ensure CSP is effective against XSS attacks
User Experience
Impact
Issue
Serves images with low resolution
General
Impact
Issue
Detected JavaScript libraries
Missing source maps for large first-party JavaScript
dfarber.com SEO score
Content Best Practices
Format your HTML in a way that enables crawlers to better understand your app’s content.
Impact
Issue
Links do not have descriptive text
Image elements do not have [alt] attributes
Crawling and Indexing
To appear in search results, crawlers need access to your app.
Impact
Issue
Links are not crawlable
Mobile Friendly
Make sure your pages are mobile friendly so users don’t have to pinch or zoom in order to read the content pages. [Learn more](https://developers.google.com/search/mobile-sites/).
Impact
Issue
Document uses legible font sizes
Tap targets are not sized appropriately
![]()
EN
![]()
EN
UTF-8
Language claimed in HTML meta tag should match the language actually used on the web page. Otherwise Dfarber.com can be misinterpreted by Google and other search engines. Our service has detected that English is used on the page, and it matches the claimed language. Our system also found out that Dfarber.com main page’s claimed encoding is utf-8. Use of this encoding format is the best practice as the main page visitors from all over the world won’t have any issues with symbol transcription.
dfarber.com
Open Graph description is not detected on the main page of Dfarber. Lack of Open Graph description can be counter-productive for their social media presence, as such a description allows converting a website homepage (or other pages) into good-looking, rich and well-structured posts, when it is being shared on Facebook and other social media. For example, adding the following code snippet into HTML <head> tag will help to represent this web page correctly in social networks: