Report Summary

  • 0

    Performance

  • 0

    Accessibility

  • 0

    Best Practices

  • 0

    SEO

diagnoseonline.net

diagnoSEOnline | Website Diagnose Online + SEO Online Analyse

Page Load Speed

5 sec in total

First Response

303 ms

Resources Loaded

4.5 sec

Page Rendered

254 ms
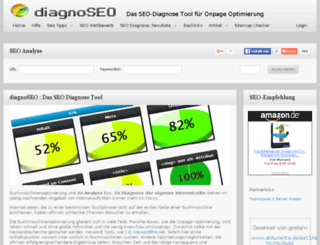
diagnoseonline.net screenshot

About Website

Welcome to diagnoseonline.net homepage info - get ready to check Diagnose Online best content right away, or after learning these important things about diagnoseonline.net

diagnoSEOnline | Website Diagnose Online + SEO Online Analyse Die Analyse-Informationen von diagnoSEOnline im unteren Bereich der Analyse-Übersicht findet man noch ausführliche Informationen über die

Visit diagnoseonline.net

Key Findings

We analyzed Diagnoseonline.net page load time and found that the first response time was 303 ms and then it took 4.7 sec to load all DOM resources and completely render a web page. This is a poor result, as 70% of websites can load faster.

Performance Metrics

diagnoseonline.net performance score

0

Network Requests Diagram

diagnoseonline.net

303 ms

www.diagnoseo.de

3519 ms

reset.css

180 ms

grid.css

181 ms

style.css

189 ms

Our browser made a total of 36 requests to load all elements on the main page. We found that 3% of them (1 request) were addressed to the original Diagnoseonline.net, 67% (24 requests) were made to Diagnoseo.de and 6% (2 requests) were made to Apis.google.com. The less responsive or slowest element that took the longest time to load (3.5 sec) relates to the external source Diagnoseo.de.

Page Optimization Overview & Recommendations

Page size can be reduced by 626.5 kB (36%)

Content Size

1.8 MB

After Optimization

1.1 MB

In fact, the total size of Diagnoseonline.net main page is 1.8 MB. This result falls beyond the top 1M of websites and identifies a large and not optimized web page that may take ages to load. 35% of websites need less resources to load. Images take 891.5 kB which makes up the majority of the site volume.

HTML Optimization

-45%

Potential reduce by 361 B

  • Original 800 B
  • After minification 800 B
  • After compression 439 B

HTML content can be minified and compressed by a website’s server. The most efficient way is to compress content using GZIP which reduces data amount travelling through the network between server and browser. HTML code on this page is well minified. It is highly recommended that content of this web page should be compressed using GZIP, as it can save up to 361 B or 45% of the original size.

Image Optimization

-5%

Potential reduce by 48.2 kB

  • Original 891.5 kB
  • After minification 843.3 kB

Image size optimization can help to speed up a website loading time. The chart above shows the difference between the size before and after optimization. Diagnose Online images are well optimized though.

JavaScript Optimization

-66%

Potential reduce by 513.6 kB

  • Original 779.7 kB
  • After minification 753.1 kB
  • After compression 266.2 kB

It’s better to minify JavaScript in order to improve website performance. The diagram shows the current total size of all JavaScript files against the prospective JavaScript size after its minification and compression. It is highly recommended that all JavaScript files should be compressed and minified as it can save up to 513.6 kB or 66% of the original size.

CSS Optimization

-81%

Potential reduce by 64.5 kB

  • Original 79.1 kB
  • After minification 68.5 kB
  • After compression 14.6 kB

CSS files minification is very important to reduce a web page rendering time. The faster CSS files can load, the earlier a page can be rendered. Diagnoseonline.net needs all CSS files to be minified and compressed as it can save up to 64.5 kB or 81% of the original size.

Requests Breakdown

Number of requests can be reduced by 21 (60%)

Requests Now

35

After Optimization

14

The browser has sent 35 CSS, Javascripts, AJAX and image requests in order to completely render the main page of Diagnose Online. We recommend that multiple CSS and JavaScript files should be merged into one by each type, as it can help reduce assets requests from 14 to 1 for JavaScripts and from 9 to 1 for CSS and as a result speed up the page load time.

SEO Factors

diagnoseonline.net SEO score

0

Language and Encoding

  • Language Detected

    DE

  • Language Claimed

    N/A

  • Encoding

    UTF-8

Language claimed in HTML meta tag should match the language actually used on the web page. Otherwise Diagnoseonline.net can be misinterpreted by Google and other search engines. Our service has detected that German is used on the page, and neither this language nor any other was claimed in <html> or <meta> tags. Our system also found out that Diagnoseonline.net main page’s claimed encoding is utf-8. Use of this encoding format is the best practice as the main page visitors from all over the world won’t have any issues with symbol transcription.

Social Sharing Optimization

Open Graph description is not detected on the main page of Diagnose Online. Lack of Open Graph description can be counter-productive for their social media presence, as such a description allows converting a website homepage (or other pages) into good-looking, rich and well-structured posts, when it is being shared on Facebook and other social media. For example, adding the following code snippet into HTML <head> tag will help to represent this web page correctly in social networks: