Report Summary

  • 80

    Performance

    Renders faster than
    86% of other websites

  • 80

    Accessibility

    Visual factors better than
    that of 49% of websites

  • 67

    Best Practices

    More advanced features
    available than in
    24% of websites

  • 62

    SEO

    Google-friendlier than
    23% of websites

dynamationresearch.com

Aerospace Inventory Search - Dynamation Research, Inc

Page Load Speed

852 ms in total

First Response

181 ms

Resources Loaded

559 ms

Page Rendered

112 ms
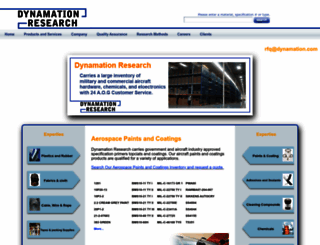
dynamationresearch.com screenshot

About Website

Visit dynamationresearch.com now to see the best up-to-date Dynamation Research content and also check out these interesting facts you probably never knew about dynamationresearch.com

Inventory Search Dynamation Research, Inc-Your source for aerospace speciality chemicals and manufacturing Dynamation Research carries a vast and extensive inventory of aerospace chemicals. As a suppl...

Visit dynamationresearch.com

Key Findings

We analyzed Dynamationresearch.com page load time and found that the first response time was 181 ms and then it took 671 ms to load all DOM resources and completely render a web page. This is quite a good result, as only 15% of websites can load faster.

Performance Metrics

dynamationresearch.com performance score

80

Measured Metrics

name

value

score

weighting

FCP (First Contentful Paint)

Value2.1 s

80/100

10%

LCP (Largest Contentful Paint)

Value4.0 s

49/100

25%

SI (Speed Index)

Value2.1 s

99/100

10%

TBT (Total Blocking Time)

Value250 ms

84/100

30%

CLS (Cumulative Layout Shift)

Value0.01

100/100

15%

TTI (Time to Interactive)

Value3.0 s

96/100

10%

Network Requests Diagram

dynamationresearch.com

181 ms

www.dynamationresearch.com

78 ms

main_2.css

24 ms

styles.css

48 ms

jquery.min.js

7 ms

Our browser made a total of 32 requests to load all elements on the main page. We found that 91% of them (29 requests) were addressed to the original Dynamationresearch.com, 6% (2 requests) were made to Google-analytics.com and 3% (1 request) were made to Ajax.googleapis.com. The less responsive or slowest element that took the longest time to load (181 ms) belongs to the original domain Dynamationresearch.com.

Page Optimization Overview & Recommendations

Page size can be reduced by 165.9 kB (15%)

Content Size

1.1 MB

After Optimization

919.4 kB

In fact, the total size of Dynamationresearch.com main page is 1.1 MB. This result falls beyond the top 1M of websites and identifies a large and not optimized web page that may take ages to load. 30% of websites need less resources to load. Images take 1.0 MB which makes up the majority of the site volume.

HTML Optimization

-74%

Potential reduce by 9.2 kB

  • Original 12.5 kB
  • After minification 11.2 kB
  • After compression 3.3 kB

HTML content can be minified and compressed by a website’s server. The most efficient way is to compress content using GZIP which reduces data amount travelling through the network between server and browser. This page needs HTML code to be minified as it can gain 1.3 kB, which is 11% of the original size. It is highly recommended that content of this web page should be compressed using GZIP, as it can save up to 9.2 kB or 74% of the original size.

Image Optimization

-13%

Potential reduce by 132.1 kB

  • Original 1.0 MB
  • After minification 868.0 kB

Image size optimization can help to speed up a website loading time. The chart above shows the difference between the size before and after optimization. Obviously, Dynamation Research needs image optimization as it can save up to 132.1 kB or 13% of the original volume. The most popular and efficient tools for JPEG and PNG image optimization are Jpegoptim and PNG Crush.

JavaScript Optimization

-22%

Potential reduce by 13.1 kB

  • Original 59.1 kB
  • After minification 56.8 kB
  • After compression 46.0 kB

It’s better to minify JavaScript in order to improve website performance. The diagram shows the current total size of all JavaScript files against the prospective JavaScript size after its minification and compression. It is highly recommended that all JavaScript files should be compressed and minified as it can save up to 13.1 kB or 22% of the original size.

CSS Optimization

-84%

Potential reduce by 11.5 kB

  • Original 13.7 kB
  • After minification 8.2 kB
  • After compression 2.1 kB

CSS files minification is very important to reduce a web page rendering time. The faster CSS files can load, the earlier a page can be rendered. Dynamationresearch.com needs all CSS files to be minified and compressed as it can save up to 11.5 kB or 84% of the original size.

Requests Breakdown

Number of requests can be reduced by 3 (10%)

Requests Now

29

After Optimization

26

The browser has sent 29 CSS, Javascripts, AJAX and image requests in order to completely render the main page of Dynamation Research. We recommend that multiple CSS and JavaScript files should be merged into one by each type, as it can help reduce assets requests from 4 to 1 for JavaScripts and as a result speed up the page load time.

Accessibility Review

dynamationresearch.com accessibility score

80

Accessibility Issues

Contrast

These are opportunities to improve the legibility of your content.

Impact

Issue

High

Background and foreground colors do not have a sufficient contrast ratio.

Internationalization and localization

These are opportunities to improve the interpretation of your content by users in different locales.

Impact

Issue

High

<html> element does not have a [lang] attribute

Names and labels

These are opportunities to improve the semantics of the controls in your application. This may enhance the experience for users of assistive technology, like a screen reader.

Impact

Issue

High

Image elements do not have [alt] attributes

Best Practices

dynamationresearch.com best practices score

67

Areas of Improvement

Trust and Safety

Impact

Issue

High

Does not use HTTPS

High

Includes front-end JavaScript libraries with known security vulnerabilities

Low

Ensure CSP is effective against XSS attacks

User Experience

Impact

Issue

High

Serves images with low resolution

General

Impact

Issue

Low

Detected JavaScript libraries

High

Browser errors were logged to the console

SEO Factors

dynamationresearch.com SEO score

62

Search Engine Optimization Advices

Crawling and Indexing

To appear in search results, crawlers need access to your app.

Impact

Issue

High

robots.txt is not valid

Content Best Practices

Format your HTML in a way that enables crawlers to better understand your app’s content.

Impact

Issue

High

Image elements do not have [alt] attributes

Language and Encoding

  • Language Detected

    EN

  • Language Claimed

    N/A

  • Encoding

    UTF-8

Language claimed in HTML meta tag should match the language actually used on the web page. Otherwise Dynamationresearch.com can be misinterpreted by Google and other search engines. Our service has detected that English is used on the page, and neither this language nor any other was claimed in <html> or <meta> tags. Our system also found out that Dynamationresearch.com main page’s claimed encoding is utf-8. Use of this encoding format is the best practice as the main page visitors from all over the world won’t have any issues with symbol transcription.

Social Sharing Optimization

Open Graph description is not detected on the main page of Dynamation Research. Lack of Open Graph description can be counter-productive for their social media presence, as such a description allows converting a website homepage (or other pages) into good-looking, rich and well-structured posts, when it is being shared on Facebook and other social media. For example, adding the following code snippet into HTML <head> tag will help to represent this web page correctly in social networks: