Report Summary

  • 0

    Performance

  • 0

    Accessibility

  • 0

    Best Practices

  • 0

    SEO

easydiag.com

Apache2 Debian Default Page: It works

Page Load Speed

4.7 sec in total

First Response

279 ms

Resources Loaded

3.8 sec

Page Rendered

642 ms
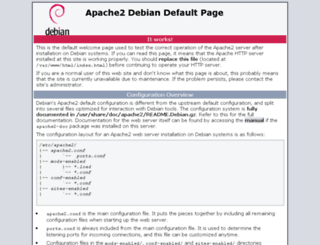
easydiag.com screenshot

About Website

Welcome to easydiag.com homepage info - get ready to check Easydiag best content right away, or after learning these important things about easydiag.com

Faites confiance au N°1 du diagnostic immobilier en France, Commandez en ligne vos diagnostics immobiliers obligatoires et bénéficiez des meilleurs prix

Visit easydiag.com

Key Findings

We analyzed Easydiag.com page load time and found that the first response time was 279 ms and then it took 4.4 sec to load all DOM resources and completely render a web page. This is a poor result, as 65% of websites can load faster.

Performance Metrics

easydiag.com performance score

0

Network Requests Diagram

easydiag.com

279 ms

www.allodiagnostic.com

1137 ms

bundle_8b40905bb393a20b29de5712c8baa514.css

341 ms

bundle_9aa5f051d14bb4f472f972849a9d668a.js

673 ms

conversion.js

34 ms

Our browser made a total of 88 requests to load all elements on the main page. We found that 1% of them (1 request) were addressed to the original Easydiag.com, 86% (76 requests) were made to Allodiagnostic.com and 2% (2 requests) were made to Stats.g.doubleclick.net. The less responsive or slowest element that took the longest time to load (1.1 sec) relates to the external source Allodiagnostic.com.

Page Optimization Overview & Recommendations

Page size can be reduced by 705.1 kB (45%)

Content Size

1.6 MB

After Optimization

879.1 kB

In fact, the total size of Easydiag.com main page is 1.6 MB. This result falls beyond the top 1M of websites and identifies a large and not optimized web page that may take ages to load. 35% of websites need less resources to load. Images take 783.3 kB which makes up the majority of the site volume.

HTML Optimization

-85%

Potential reduce by 93.7 kB

  • Original 109.8 kB
  • After minification 87.6 kB
  • After compression 16.1 kB

HTML content can be minified and compressed by a website’s server. The most efficient way is to compress content using GZIP which reduces data amount travelling through the network between server and browser. This page needs HTML code to be minified as it can gain 22.2 kB, which is 20% of the original size. It is highly recommended that content of this web page should be compressed using GZIP, as it can save up to 93.7 kB or 85% of the original size.

Image Optimization

-11%

Potential reduce by 86.9 kB

  • Original 783.3 kB
  • After minification 696.4 kB

Image size optimization can help to speed up a website loading time. The chart above shows the difference between the size before and after optimization. Obviously, Easydiag needs image optimization as it can save up to 86.9 kB or 11% of the original volume. The most popular and efficient tools for JPEG and PNG image optimization are Jpegoptim and PNG Crush.

JavaScript Optimization

-68%

Potential reduce by 291.1 kB

  • Original 427.0 kB
  • After minification 404.1 kB
  • After compression 135.8 kB

It’s better to minify JavaScript in order to improve website performance. The diagram shows the current total size of all JavaScript files against the prospective JavaScript size after its minification and compression. It is highly recommended that all JavaScript files should be compressed and minified as it can save up to 291.1 kB or 68% of the original size.

CSS Optimization

-88%

Potential reduce by 233.3 kB

  • Original 264.1 kB
  • After minification 193.1 kB
  • After compression 30.8 kB

CSS files minification is very important to reduce a web page rendering time. The faster CSS files can load, the earlier a page can be rendered. Easydiag.com needs all CSS files to be minified and compressed as it can save up to 233.3 kB or 88% of the original size.

Requests Breakdown

Number of requests can be reduced by 20 (26%)

Requests Now

76

After Optimization

56

The browser has sent 76 CSS, Javascripts, AJAX and image requests in order to completely render the main page of Easydiag. We recommend that multiple CSS and JavaScript files should be merged into one by each type, as it can help reduce assets requests from 6 to 1 for JavaScripts and as a result speed up the page load time.

SEO Factors

easydiag.com SEO score

0

Language and Encoding

  • Language Detected

    EN

  • Language Claimed

    FR

  • Encoding

    UTF-8

Language claimed in HTML meta tag should match the language actually used on the web page. Otherwise Easydiag.com can be misinterpreted by Google and other search engines. Our service has detected that English is used on the page, and it does not match the claimed French language. Our system also found out that Easydiag.com main page’s claimed encoding is utf-8. Use of this encoding format is the best practice as the main page visitors from all over the world won’t have any issues with symbol transcription.

Social Sharing Optimization

Open Graph description is not detected on the main page of Easydiag. Lack of Open Graph description can be counter-productive for their social media presence, as such a description allows converting a website homepage (or other pages) into good-looking, rich and well-structured posts, when it is being shared on Facebook and other social media. For example, adding the following code snippet into HTML <head> tag will help to represent this web page correctly in social networks: