Report Summary

  • 58

    Performance

    Renders faster than
    74% of other websites

  • 72

    Accessibility

    Visual factors better than
    that of 37% of websites

  • 0

    Best Practices

  • 93

    SEO

    Google-friendlier than
    83% of websites

elastography.de

Elastography Group - Charité – Universitätsmedizin Berlin

Page Load Speed

11 sec in total

First Response

778 ms

Resources Loaded

9.9 sec

Page Rendered

261 ms

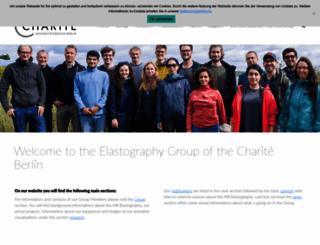
elastography.de screenshot

About Website

Visit elastography.de now to see the best up-to-date Elastography content and also check out these interesting facts you probably never knew about elastography.de

Information on the range of services at Charité – Universtätsmedizin Berlin for patients, physicians, students and scientists

Visit elastography.de

Key Findings

We analyzed Elastography.de page load time and found that the first response time was 778 ms and then it took 10.2 sec to load all DOM resources and completely render a web page. This is a poor result, as 90% of websites can load faster.

Performance Metrics

elastography.de performance score

58

Measured Metrics

name

value

score

weighting

FCP (First Contentful Paint)

Value2.9 s

52/100

10%

LCP (Largest Contentful Paint)

Value2.9 s

80/100

25%

SI (Speed Index)

Value8.8 s

16/100

10%

TBT (Total Blocking Time)

Value450 ms

62/100

30%

CLS (Cumulative Layout Shift)

Value0.188

65/100

15%

TTI (Time to Interactive)

Value10.2 s

25/100

10%

Network Requests Diagram

elastography.de

778 ms

elastography.de

8229 ms

wp-emoji-release.min.js

314 ms

front.min.css

438 ms

js_composer.min.css

914 ms

Our browser made a total of 23 requests to load all elements on the main page. We found that all of those requests were addressed to Elastography.de and no external sources were called. The less responsive or slowest element that took the longest time to load (8.2 sec) belongs to the original domain Elastography.de.

Page Optimization Overview & Recommendations

Page size can be reduced by 136.6 kB (5%)

Content Size

2.9 MB

After Optimization

2.7 MB

In fact, the total size of Elastography.de main page is 2.9 MB. This result falls beyond the top 1M of websites and identifies a large and not optimized web page that may take ages to load. 70% of websites need less resources to load. Images take 2.4 MB which makes up the majority of the site volume.

HTML Optimization

-67%

Potential reduce by 40.5 kB

  • Original 60.3 kB
  • After minification 59.5 kB
  • After compression 19.8 kB

HTML content can be minified and compressed by a website’s server. The most efficient way is to compress content using GZIP which reduces data amount travelling through the network between server and browser. HTML code on this page is well minified. It is highly recommended that content of this web page should be compressed using GZIP, as it can save up to 40.5 kB or 67% of the original size.

Image Optimization

-2%

Potential reduce by 51.7 kB

  • Original 2.4 MB
  • After minification 2.3 MB

Image size optimization can help to speed up a website loading time. The chart above shows the difference between the size before and after optimization. Elastography images are well optimized though.

JavaScript Optimization

-4%

Potential reduce by 6.4 kB

  • Original 180.2 kB
  • After minification 180.2 kB
  • After compression 173.8 kB

It’s better to minify JavaScript in order to improve website performance. The diagram shows the current total size of all JavaScript files against the prospective JavaScript size after its minification and compression. This website has mostly compressed JavaScripts.

CSS Optimization

-16%

Potential reduce by 38.0 kB

  • Original 236.0 kB
  • After minification 235.4 kB
  • After compression 198.0 kB

CSS files minification is very important to reduce a web page rendering time. The faster CSS files can load, the earlier a page can be rendered. Elastography.de needs all CSS files to be minified and compressed as it can save up to 38.0 kB or 16% of the original size.

Requests Breakdown

Number of requests can be reduced by 16 (80%)

Requests Now

20

After Optimization

4

The browser has sent 20 CSS, Javascripts, AJAX and image requests in order to completely render the main page of Elastography. We recommend that multiple CSS and JavaScript files should be merged into one by each type, as it can help reduce assets requests from 8 to 1 for JavaScripts and from 10 to 1 for CSS and as a result speed up the page load time.

Accessibility Review

elastography.de accessibility score

72

Accessibility Issues

ARIA

These are opportunities to improve the usage of ARIA in your application which may enhance the experience for users of assistive technology, like a screen reader.

Impact

Issue

High

Elements with an ARIA [role] that require children to contain a specific [role] are missing some or all of those required children.

Contrast

These are opportunities to improve the legibility of your content.

Impact

Issue

High

Background and foreground colors do not have a sufficient contrast ratio.

Navigation

These are opportunities to improve keyboard navigation in your application.

Impact

Issue

High

[id] attributes on active, focusable elements are not unique

Names and labels

These are opportunities to improve the semantics of the controls in your application. This may enhance the experience for users of assistive technology, like a screen reader.

Impact

Issue

High

Links do not have a discernible name

Tables and lists

These are opportunities to improve the experience of reading tabular or list data using assistive technology, like a screen reader.

Impact

Issue

High

List items (<li>) are not contained within <ul> or <ol> parent elements.

Best practices

These items highlight common accessibility best practices.

Impact

Issue

High

[user-scalable="no"] is used in the <meta name="viewport"> element or the [maximum-scale] attribute is less than 5.

SEO Factors

elastography.de SEO score

93

Search Engine Optimization Advices

Mobile Friendly

Make sure your pages are mobile friendly so users don’t have to pinch or zoom in order to read the content pages. [Learn more](https://developers.google.com/search/mobile-sites/).

Impact

Issue

High

Document uses legible font sizes

Language and Encoding

  • Language Detected

    EN

  • Language Claimed

    DE

  • Encoding

    UTF-8

Language claimed in HTML meta tag should match the language actually used on the web page. Otherwise Elastography.de can be misinterpreted by Google and other search engines. Our service has detected that English is used on the page, and it does not match the claimed German language. Our system also found out that Elastography.de main page’s claimed encoding is utf-8. Use of this encoding format is the best practice as the main page visitors from all over the world won’t have any issues with symbol transcription.

Social Sharing Optimization

Open Graph description is not detected on the main page of Elastography. Lack of Open Graph description can be counter-productive for their social media presence, as such a description allows converting a website homepage (or other pages) into good-looking, rich and well-structured posts, when it is being shared on Facebook and other social media. For example, adding the following code snippet into HTML <head> tag will help to represent this web page correctly in social networks: