Report Summary

  • 32

    Performance

    Renders faster than
    52% of other websites

  • 71

    Accessibility

    Visual factors better than
    that of 37% of websites

  • 75

    Best Practices

    More advanced features
    available than in
    36% of websites

  • 93

    SEO

    Google-friendlier than
    84% of websites

enticare.com

Audiologist & ENT Specialists | Serving Greater Phoenix, AZ | Enticare

Page Load Speed

1.1 sec in total

First Response

17 ms

Resources Loaded

764 ms

Page Rendered

362 ms

enticare.com screenshot

About Website

Click here to check amazing Enticare content for United States. Otherwise, check out these important facts you probably never knew about enticare.com

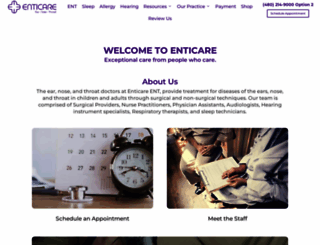
Meet with a local Ear, Nose & Throat (ENT) specialist or Audiologist. We have seven locations in Greater Phoenix to help with hearing, sleep, & allergy needs.

Visit enticare.com

Key Findings

We analyzed Enticare.com page load time and found that the first response time was 17 ms and then it took 1.1 sec to load all DOM resources and completely render a web page. This is quite a good result, as only 20% of websites can load faster.

Performance Metrics

enticare.com performance score

32

Measured Metrics

name

value

score

weighting

FCP (First Contentful Paint)

Value3.8 s

27/100

10%

LCP (Largest Contentful Paint)

Value5.4 s

21/100

25%

SI (Speed Index)

Value4.7 s

68/100

10%

TBT (Total Blocking Time)

Value1,670 ms

11/100

30%

CLS (Cumulative Layout Shift)

Value0.109

87/100

15%

TTI (Time to Interactive)

Value15.0 s

7/100

10%

Network Requests Diagram

enticare.com

17 ms

enticare.com

34 ms

wc-blocks-vendors-style.css

10 ms

wc-all-blocks-style.css

13 ms

divi-stop-stacking.css

31 ms

Our browser made a total of 105 requests to load all elements on the main page. We found that 51% of them (54 requests) were addressed to the original Enticare.com, 34% (36 requests) were made to Fonts.gstatic.com and 2% (2 requests) were made to Googletagmanager.com. The less responsive or slowest element that took the longest time to load (214 ms) relates to the external source Pixel.wp.com.

Page Optimization Overview & Recommendations

Page size can be reduced by 191.5 kB (16%)

Content Size

1.2 MB

After Optimization

1.0 MB

In fact, the total size of Enticare.com main page is 1.2 MB. This result falls beyond the top 1M of websites and identifies a large and not optimized web page that may take ages to load. 80% of websites need less resources to load and that’s why Accessify’s recommendations for optimization and resource minification can be helpful for this project. Images take 610.7 kB which makes up the majority of the site volume.

HTML Optimization

-82%

Potential reduce by 70.6 kB

  • Original 86.0 kB
  • After minification 83.2 kB
  • After compression 15.4 kB

HTML content can be minified and compressed by a website’s server. The most efficient way is to compress content using GZIP which reduces data amount travelling through the network between server and browser. HTML code on this page is well minified. It is highly recommended that content of this web page should be compressed using GZIP, as it can save up to 70.6 kB or 82% of the original size.

Image Optimization

-0%

Potential reduce by 45 B

  • Original 610.7 kB
  • After minification 610.6 kB

Image size optimization can help to speed up a website loading time. The chart above shows the difference between the size before and after optimization. Enticare images are well optimized though.

JavaScript Optimization

-29%

Potential reduce by 81.7 kB

  • Original 279.9 kB
  • After minification 279.9 kB
  • After compression 198.2 kB

It’s better to minify JavaScript in order to improve website performance. The diagram shows the current total size of all JavaScript files against the prospective JavaScript size after its minification and compression. It is highly recommended that all JavaScript files should be compressed and minified as it can save up to 81.7 kB or 29% of the original size.

CSS Optimization

-18%

Potential reduce by 39.1 kB

  • Original 220.8 kB
  • After minification 220.4 kB
  • After compression 181.7 kB

CSS files minification is very important to reduce a web page rendering time. The faster CSS files can load, the earlier a page can be rendered. Enticare.com needs all CSS files to be minified and compressed as it can save up to 39.1 kB or 18% of the original size.

Requests Breakdown

Number of requests can be reduced by 49 (74%)

Requests Now

66

After Optimization

17

The browser has sent 66 CSS, Javascripts, AJAX and image requests in order to completely render the main page of Enticare. We recommend that multiple CSS and JavaScript files should be merged into one by each type, as it can help reduce assets requests from 28 to 1 for JavaScripts and from 23 to 1 for CSS and as a result speed up the page load time.

Accessibility Review

enticare.com accessibility score

71

Accessibility Issues

Contrast

These are opportunities to improve the legibility of your content.

Impact

Issue

High

Background and foreground colors do not have a sufficient contrast ratio.

Navigation

These are opportunities to improve keyboard navigation in your application.

Impact

Issue

High

Heading elements are not in a sequentially-descending order

Names and labels

These are opportunities to improve the semantics of the controls in your application. This may enhance the experience for users of assistive technology, like a screen reader.

Impact

Issue

High

Links do not have a discernible name

Best practices

These items highlight common accessibility best practices.

Impact

Issue

High

[user-scalable="no"] is used in the <meta name="viewport"> element or the [maximum-scale] attribute is less than 5.

Best Practices

enticare.com best practices score

75

Areas of Improvement

Trust and Safety

Impact

Issue

High

Does not use HTTPS

Low

Ensure CSP is effective against XSS attacks

User Experience

Impact

Issue

High

Displays images with incorrect aspect ratio

General

Impact

Issue

Low

Detected JavaScript libraries

High

Issues were logged in the Issues panel in Chrome Devtools

SEO Factors

enticare.com SEO score

93

Search Engine Optimization Advices

Crawling and Indexing

To appear in search results, crawlers need access to your app.

Impact

Issue

High

Links are not crawlable

Mobile Friendly

Make sure your pages are mobile friendly so users don’t have to pinch or zoom in order to read the content pages. [Learn more](https://developers.google.com/search/mobile-sites/).

Impact

Issue

High

Document uses legible font sizes

Language and Encoding

  • Language Detected

    EN

  • Language Claimed

    EN

  • Encoding

    UTF-8

Language claimed in HTML meta tag should match the language actually used on the web page. Otherwise Enticare.com can be misinterpreted by Google and other search engines. Our service has detected that English is used on the page, and it matches the claimed language. Our system also found out that Enticare.com main page’s claimed encoding is utf-8. Use of this encoding format is the best practice as the main page visitors from all over the world won’t have any issues with symbol transcription.

Social Sharing Optimization

Open Graph data is detected on the main page of Enticare. This is the best way to make the web page social media friendly. Here is how it looks like on Facebook: