Report Summary

  • 49

    Performance

    Renders faster than
    68% of other websites

  • 81

    Accessibility

    Visual factors better than
    that of 52% of websites

  • 75

    Best Practices

    More advanced features
    available than in
    36% of websites

  • 93

    SEO

    Google-friendlier than
    84% of websites

ganttplanner.com

GANTTplanner: Turn your Google Calendar into a Gantt chart
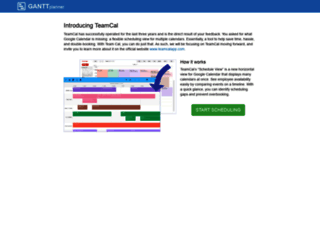
Page Load Speed

853 ms in total

First Response

75 ms

Resources Loaded

641 ms

Page Rendered

137 ms

ganttplanner.com screenshot

About Website

Visit ganttplanner.com now to see the best up-to-date GANTTplanner content for United States and also check out these interesting facts you probably never knew about ganttplanner.com

A tool for everyone who uses Google Calendar to manage their projects. Free 30-day premium trial! Share your gantt chart with your team and clients.

Visit ganttplanner.com

Key Findings

We analyzed Ganttplanner.com page load time and found that the first response time was 75 ms and then it took 778 ms to load all DOM resources and completely render a web page. This is quite a good result, as only 15% of websites can load faster.

Performance Metrics

ganttplanner.com performance score

49

Measured Metrics

name

value

score

weighting

FCP (First Contentful Paint)

Value2.7 s

59/100

10%

LCP (Largest Contentful Paint)

Value5.6 s

17/100

25%

SI (Speed Index)

Value2.8 s

96/100

10%

TBT (Total Blocking Time)

Value1,160 ms

22/100

30%

CLS (Cumulative Layout Shift)

Value0.072

96/100

15%

TTI (Time to Interactive)

Value4.8 s

78/100

10%

Network Requests Diagram

www.ganttplanner.com

75 ms

bReJq9RjDrk2RxQhDkAq2EE8qq8.js

224 ms

eedf9ee80c2faa4e1b9ab9017cdfcb88-bootstrap.min.css

57 ms

2f52a583d57a2cd11c4a4882f07c49cb-master.min.css

70 ms

04425bbdc6243fc6e54bf8984fe50330-font-awesome.min.css

77 ms

Our browser made a total of 16 requests to load all elements on the main page. We found that 75% of them (12 requests) were addressed to the original Ganttplanner.com, 13% (2 requests) were made to Google-analytics.com and 6% (1 request) were made to Widget.uservoice.com. The less responsive or slowest element that took the longest time to load (224 ms) belongs to the original domain Ganttplanner.com.

Page Optimization Overview & Recommendations

Page size can be reduced by 5.7 kB (4%)

Content Size

145.8 kB

After Optimization

140.1 kB

In fact, the total size of Ganttplanner.com main page is 145.8 kB. This result falls beyond the top 1M of websites and identifies a large and not optimized web page that may take ages to load. 25% of websites need less resources to load. Images take 116.3 kB which makes up the majority of the site volume.

HTML Optimization

-67%

Potential reduce by 5.7 kB

  • Original 8.5 kB
  • After minification 7.1 kB
  • After compression 2.8 kB

HTML content can be minified and compressed by a website’s server. The most efficient way is to compress content using GZIP which reduces data amount travelling through the network between server and browser. This page needs HTML code to be minified as it can gain 1.3 kB, which is 16% of the original size. It is highly recommended that content of this web page should be compressed using GZIP, as it can save up to 5.7 kB or 67% of the original size.

Image Optimization

-0%

Potential reduce by 0 B

  • Original 116.3 kB
  • After minification 116.3 kB

Image size optimization can help to speed up a website loading time. The chart above shows the difference between the size before and after optimization. GANTTplanner images are well optimized though.

JavaScript Optimization

-0%

Potential reduce by 50 B

  • Original 21.0 kB
  • After minification 21.0 kB
  • After compression 20.9 kB

It’s better to minify JavaScript in order to improve website performance. The diagram shows the current total size of all JavaScript files against the prospective JavaScript size after its minification and compression. This website has mostly compressed JavaScripts.

Requests Breakdown

Number of requests can be reduced by 9 (64%)

Requests Now

14

After Optimization

5

The browser has sent 14 CSS, Javascripts, AJAX and image requests in order to completely render the main page of GANTTplanner. We recommend that multiple CSS and JavaScript files should be merged into one by each type, as it can help reduce assets requests from 6 to 1 for JavaScripts and from 5 to 1 for CSS and as a result speed up the page load time.

Accessibility Review

ganttplanner.com accessibility score

81

Accessibility Issues

Contrast

These are opportunities to improve the legibility of your content.

Impact

Issue

High

Background and foreground colors do not have a sufficient contrast ratio.

Internationalization and localization

These are opportunities to improve the interpretation of your content by users in different locales.

Impact

Issue

High

<html> element does not have a [lang] attribute

Names and labels

These are opportunities to improve the semantics of the controls in your application. This may enhance the experience for users of assistive technology, like a screen reader.

Impact

Issue

High

Image elements do not have [alt] attributes

Best Practices

ganttplanner.com best practices score

75

Areas of Improvement

Trust and Safety

Impact

Issue

High

Does not use HTTPS

High

Includes front-end JavaScript libraries with known security vulnerabilities

Low

Ensure CSP is effective against XSS attacks

General

Impact

Issue

Low

Detected JavaScript libraries

High

Browser errors were logged to the console

High

Page has valid source maps

SEO Factors

ganttplanner.com SEO score

93

Search Engine Optimization Advices

Content Best Practices

Format your HTML in a way that enables crawlers to better understand your app’s content.

Impact

Issue

High

Image elements do not have [alt] attributes

Mobile Friendly

Make sure your pages are mobile friendly so users don’t have to pinch or zoom in order to read the content pages. [Learn more](https://developers.google.com/search/mobile-sites/).

Impact

Issue

High

Document uses legible font sizes

Language and Encoding

  • Language Detected

    EN

  • Language Claimed

    N/A

  • Encoding

    UTF-8

Language claimed in HTML meta tag should match the language actually used on the web page. Otherwise Ganttplanner.com can be misinterpreted by Google and other search engines. Our service has detected that English is used on the page, and neither this language nor any other was claimed in <html> or <meta> tags. Our system also found out that Ganttplanner.com main page’s claimed encoding is utf-8. Use of this encoding format is the best practice as the main page visitors from all over the world won’t have any issues with symbol transcription.

Social Sharing Optimization

Open Graph data is detected on the main page of GANTTplanner. This is the best way to make the web page social media friendly. Here is how it looks like on Facebook: