Report Summary

  • 48

    Performance

    Renders faster than
    67% of other websites

  • 54

    Accessibility

    Visual factors better than
    that of 23% of websites

  • 58

    Best Practices

    More advanced features
    available than in
    19% of websites

  • 85

    SEO

    Google-friendlier than
    56% of websites

hnhagl.com

燃油蒸汽锅炉_燃油燃气热风炉_燃气热水锅炉_木材防腐罐_蒸汽发生器_导热油炉_生物质蒸汽锅炉_粮食烘干热风炉_矿用热风炉_真空木材防腐设备_阻燃设备_防腐罐

Page Load Speed

19.1 sec in total

First Response

1.4 sec

Resources Loaded

13.8 sec

Page Rendered

3.9 sec

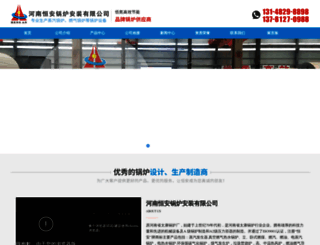
hnhagl.com screenshot

About Website

Click here to check amazing Hnhagl content. Otherwise, check out these important facts you probably never knew about hnhagl.com

燃气蒸汽锅炉,生物质蒸汽锅炉,导热油炉,蒸汽发生器,木材防腐罐,燃油蒸汽锅炉,燃气热水锅炉,燃气热风炉,燃油热风炉,锅炉,蒸汽锅炉,河南省恒安锅炉有限公司主要产品包括:蒸汽发生器.真空燃气热水锅炉、立、卧式燃煤、燃汽、燃油、电蒸汽锅炉,电热水锅炉.环保煤碳气化锅炉,煤气发生炉,垃圾焚烧炉,高、中温热风炉,燃油燃气导热油炉.有机热载体炉及分气缸、储气罐.木材防腐灌.灭菌锅.燃油燃热风锅炉及二类压力容...

Visit hnhagl.com

Key Findings

We analyzed Hnhagl.com page load time and found that the first response time was 1.4 sec and then it took 17.8 sec to load all DOM resources and completely render a web page. This is an excellent result, as only a small number of websites can load faster.

Performance Metrics

hnhagl.com performance score

48

Measured Metrics

name

value

score

weighting

FCP (First Contentful Paint)

Value5.2 s

8/100

10%

LCP (Largest Contentful Paint)

Value8.4 s

2/100

25%

SI (Speed Index)

Value13.1 s

2/100

10%

TBT (Total Blocking Time)

Value20 ms

100/100

30%

CLS (Cumulative Layout Shift)

Value0.195

63/100

15%

TTI (Time to Interactive)

Value5.8 s

67/100

10%

Network Requests Diagram

www.hnhagl.com

1353 ms

public.css

873 ms

blue.css

450 ms

colstyle.css

666 ms

jquery.js

1111 ms

Our browser made a total of 83 requests to load all elements on the main page. We found that 1% of them (1 request) were addressed to the original Hnhagl.com, 47% (39 requests) were made to Img.tiantis.com and 22% (18 requests) were made to Ui.tiantis.com. The less responsive or slowest element that took the longest time to load (10.3 sec) relates to the external source Img.tiantis.com.

Page Optimization Overview & Recommendations

Page size can be reduced by 138.8 kB (10%)

Content Size

1.4 MB

After Optimization

1.3 MB

In fact, the total size of Hnhagl.com main page is 1.4 MB. This result falls beyond the top 1M of websites and identifies a large and not optimized web page that may take ages to load. 45% of websites need less resources to load. Images take 944.0 kB which makes up the majority of the site volume.

HTML Optimization

-87%

Potential reduce by 57.2 kB

  • Original 65.4 kB
  • After minification 63.8 kB
  • After compression 8.2 kB

HTML content can be minified and compressed by a website’s server. The most efficient way is to compress content using GZIP which reduces data amount travelling through the network between server and browser. HTML code on this page is well minified. It is highly recommended that content of this web page should be compressed using GZIP, as it can save up to 57.2 kB or 87% of the original size.

Image Optimization

-2%

Potential reduce by 21.8 kB

  • Original 944.0 kB
  • After minification 922.2 kB

Image size optimization can help to speed up a website loading time. The chart above shows the difference between the size before and after optimization. Hnhagl images are well optimized though.

JavaScript Optimization

-14%

Potential reduce by 56.8 kB

  • Original 404.2 kB
  • After minification 396.8 kB
  • After compression 347.4 kB

It’s better to minify JavaScript in order to improve website performance. The diagram shows the current total size of all JavaScript files against the prospective JavaScript size after its minification and compression. It is highly recommended that all JavaScript files should be compressed and minified as it can save up to 56.8 kB or 14% of the original size.

CSS Optimization

-15%

Potential reduce by 3.1 kB

  • Original 20.0 kB
  • After minification 20.0 kB
  • After compression 17.0 kB

CSS files minification is very important to reduce a web page rendering time. The faster CSS files can load, the earlier a page can be rendered. Hnhagl.com needs all CSS files to be minified and compressed as it can save up to 3.1 kB or 15% of the original size.

Requests Breakdown

Number of requests can be reduced by 33 (41%)

Requests Now

80

After Optimization

47

The browser has sent 80 CSS, Javascripts, AJAX and image requests in order to completely render the main page of Hnhagl. We recommend that multiple CSS and JavaScript files should be merged into one by each type, as it can help reduce assets requests from 26 to 1 for JavaScripts and from 4 to 1 for CSS and as a result speed up the page load time.

Accessibility Review

hnhagl.com accessibility score

54

Accessibility Issues

Contrast

These are opportunities to improve the legibility of your content.

Impact

Issue

High

Background and foreground colors do not have a sufficient contrast ratio.

Internationalization and localization

These are opportunities to improve the interpretation of your content by users in different locales.

Impact

Issue

High

<html> element does not have a [lang] attribute

Names and labels

These are opportunities to improve the semantics of the controls in your application. This may enhance the experience for users of assistive technology, like a screen reader.

Impact

Issue

High

Image elements do not have [alt] attributes

Best practices

These items highlight common accessibility best practices.

Impact

Issue

High

[user-scalable="no"] is used in the <meta name="viewport"> element or the [maximum-scale] attribute is less than 5.

Best Practices

hnhagl.com best practices score

58

Areas of Improvement

Trust and Safety

Impact

Issue

High

Does not use HTTPS

High

Includes front-end JavaScript libraries with known security vulnerabilities

Low

Ensure CSP is effective against XSS attacks

User Experience

Impact

Issue

High

Displays images with incorrect aspect ratio

High

Serves images with low resolution

General

Impact

Issue

Low

Detected JavaScript libraries

High

Browser errors were logged to the console

High

Page has valid source maps

SEO Factors

hnhagl.com SEO score

85

Search Engine Optimization Advices

Crawling and Indexing

To appear in search results, crawlers need access to your app.

Impact

Issue

High

Links are not crawlable

Content Best Practices

Format your HTML in a way that enables crawlers to better understand your app’s content.

Impact

Issue

High

Image elements do not have [alt] attributes

Mobile Friendly

Make sure your pages are mobile friendly so users don’t have to pinch or zoom in order to read the content pages. [Learn more](https://developers.google.com/search/mobile-sites/).

Impact

Issue

High

Document uses legible font sizes

Language and Encoding

  • Language Detected

    ZH

  • Language Claimed

    N/A

  • Encoding

    UTF-16

Language claimed in HTML meta tag should match the language actually used on the web page. Otherwise Hnhagl.com can be misinterpreted by Google and other search engines. Our service has detected that Chinese is used on the page, and neither this language nor any other was claimed in <html> or <meta> tags. Our system also found out that Hnhagl.com main page’s claimed encoding is utf-16. Changing it to UTF-8 can be a good choice, as this format is commonly used for encoding all over the web and thus their visitors won’t have any troubles with symbol transcription or reading.

Social Sharing Optimization

Open Graph description is not detected on the main page of Hnhagl. Lack of Open Graph description can be counter-productive for their social media presence, as such a description allows converting a website homepage (or other pages) into good-looking, rich and well-structured posts, when it is being shared on Facebook and other social media. For example, adding the following code snippet into HTML <head> tag will help to represent this web page correctly in social networks: