Report Summary

  • 59

    Performance

    Renders faster than
    75% of other websites

  • 89

    Accessibility

    Visual factors better than
    that of 72% of websites

  • 75

    Best Practices

    More advanced features
    available than in
    36% of websites

  • 96

    SEO

    Google-friendlier than
    91% of websites

intergic.com

Strumenti digitali per l'innovazione del tuo business - Intergic

Page Load Speed

14.4 sec in total

First Response

1 sec

Resources Loaded

5 sec

Page Rendered

8.4 sec
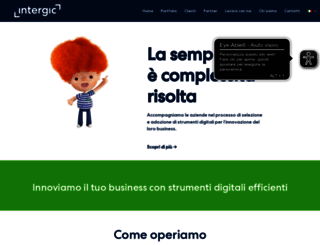
intergic.com screenshot

About Website

Welcome to intergic.com homepage info - get ready to check Intergic best content right away, or after learning these important things about intergic.com

Strumenti digitali per l'innovazione in campo UX e CRO, payment e Ad Tech Optimization. La semplicità è complessità risolta.

Visit intergic.com

Key Findings

We analyzed Intergic.com page load time and found that the first response time was 1 sec and then it took 13.3 sec to load all DOM resources and completely render a web page. This is a poor result, as 90% of websites can load faster.

Performance Metrics

intergic.com performance score

59

Measured Metrics

name

value

score

weighting

FCP (First Contentful Paint)

Value3.2 s

42/100

10%

LCP (Largest Contentful Paint)

Value3.7 s

57/100

25%

SI (Speed Index)

Value5.0 s

64/100

10%

TBT (Total Blocking Time)

Value670 ms

44/100

30%

CLS (Cumulative Layout Shift)

Value0

100/100

15%

TTI (Time to Interactive)

Value6.8 s

56/100

10%

Network Requests Diagram

intergic.com

1041 ms

74f3e19d9da48863a9e742939a0f16a7.css

976 ms

jquery.min.js

278 ms

jquery-migrate.min.js

270 ms

htmegamenu-main.js

553 ms

Our browser made a total of 83 requests to load all elements on the main page. We found that 92% of them (76 requests) were addressed to the original Intergic.com, 7% (6 requests) were made to Fonts.gstatic.com and 1% (1 request) were made to Fonts.googleapis.com. The less responsive or slowest element that took the longest time to load (1.2 sec) relates to the external source Fonts.gstatic.com.

Page Optimization Overview & Recommendations

Page size can be reduced by 226.8 kB (32%)

Content Size

701.1 kB

After Optimization

474.4 kB

In fact, the total size of Intergic.com main page is 701.1 kB. This result falls beyond the top 1M of websites and identifies a large and not optimized web page that may take ages to load. 65% of websites need less resources to load. Images take 439.6 kB which makes up the majority of the site volume.

HTML Optimization

-85%

Potential reduce by 221.4 kB

  • Original 261.5 kB
  • After minification 254.7 kB
  • After compression 40.1 kB

HTML content can be minified and compressed by a website’s server. The most efficient way is to compress content using GZIP which reduces data amount travelling through the network between server and browser. HTML code on this page is well minified. It is highly recommended that content of this web page should be compressed using GZIP, as it can save up to 221.4 kB or 85% of the original size.

Image Optimization

-1%

Potential reduce by 5.3 kB

  • Original 439.6 kB
  • After minification 434.3 kB

Image size optimization can help to speed up a website loading time. The chart above shows the difference between the size before and after optimization. Intergic images are well optimized though.

Requests Breakdown

Number of requests can be reduced by 36 (49%)

Requests Now

73

After Optimization

37

The browser has sent 73 CSS, Javascripts, AJAX and image requests in order to completely render the main page of Intergic. We recommend that multiple CSS and JavaScript files should be merged into one by each type, as it can help reduce assets requests from 37 to 1 for JavaScripts and as a result speed up the page load time.

Accessibility Review

intergic.com accessibility score

89

Accessibility Issues

Contrast

These are opportunities to improve the legibility of your content.

Impact

Issue

High

Background and foreground colors do not have a sufficient contrast ratio.

ARIA

These are opportunities to improve the usage of ARIA in your application which may enhance the experience for users of assistive technology, like a screen reader.

Impact

Issue

High

ARIA IDs are not unique

Navigation

These are opportunities to improve keyboard navigation in your application.

Impact

Issue

High

Heading elements are not in a sequentially-descending order

Best Practices

intergic.com best practices score

75

Areas of Improvement

Trust and Safety

Impact

Issue

High

Does not use HTTPS

High

Includes front-end JavaScript libraries with known security vulnerabilities

Low

Ensure CSP is effective against XSS attacks

General

Impact

Issue

Low

Detected JavaScript libraries

High

Browser errors were logged to the console

SEO Factors

intergic.com SEO score

96

Search Engine Optimization Advices

Mobile Friendly

Make sure your pages are mobile friendly so users don’t have to pinch or zoom in order to read the content pages. [Learn more](https://developers.google.com/search/mobile-sites/).

Impact

Issue

High

Document uses legible font sizes

High

Tap targets are not sized appropriately

Language and Encoding

  • Language Detected

    IT

  • Language Claimed

    IT

  • Encoding

    UTF-8

Language claimed in HTML meta tag should match the language actually used on the web page. Otherwise Intergic.com can be misinterpreted by Google and other search engines. Our service has detected that Italian is used on the page, and it matches the claimed language. Our system also found out that Intergic.com main page’s claimed encoding is utf-8. Use of this encoding format is the best practice as the main page visitors from all over the world won’t have any issues with symbol transcription.

Social Sharing Optimization

Open Graph data is detected on the main page of Intergic. This is the best way to make the web page social media friendly. Here is how it looks like on Facebook: