Report Summary

  • 93

    Performance

    Renders faster than
    92% of other websites

  • 95

    Accessibility

    Visual factors better than
    that of 87% of websites

  • 67

    Best Practices

    More advanced features
    available than in
    24% of websites

  • 73

    SEO

    Google-friendlier than
    31% of websites

Page Load Speed

5.6 sec in total

First Response

418 ms

Resources Loaded

5 sec

Page Rendered

177 ms
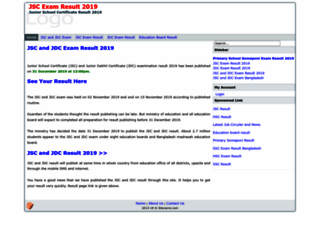
jscexamresult.com screenshot

About Website

Visit jscexamresult.com now to see the best up-to-date Jscexamresult content for Bangladesh and also check out these interesting facts you probably never knew about jscexamresult.com

JSC and JDC Exam Result Publish Here. JSC (Junior School Certificate) JDC (Junior Dakhil Certificate) Examination Results 2015 of Bangladesh Education Board and Madrasah Education Board. JSC and JDC E...

Visit jscexamresult.com

Key Findings

We analyzed Jscexamresult.com page load time and found that the first response time was 418 ms and then it took 5.2 sec to load all DOM resources and completely render a web page. This is a poor result, as 70% of websites can load faster.

Performance Metrics

jscexamresult.com performance score

93

Measured Metrics

name

value

score

weighting

FCP (First Contentful Paint)

Value2.2 s

79/100

10%

LCP (Largest Contentful Paint)

Value2.2 s

95/100

25%

SI (Speed Index)

Value2.6 s

97/100

10%

TBT (Total Blocking Time)

Value160 ms

93/100

30%

CLS (Cumulative Layout Shift)

Value0

100/100

15%

TTI (Time to Interactive)

Value3.7 s

90/100

10%

Network Requests Diagram

jscexamresult.com

418 ms

mos_jdownloads_file.css

123 ms

lightbox.css

1315 ms

attachments1.css

93 ms

mootools-core.js

115 ms

Our browser made a total of 51 requests to load all elements on the main page. We found that 71% of them (36 requests) were addressed to the original Jscexamresult.com, 20% (10 requests) were made to Static.xx.fbcdn.net and 4% (2 requests) were made to Google-analytics.com. The less responsive or slowest element that took the longest time to load (2.3 sec) belongs to the original domain Jscexamresult.com.

Page Optimization Overview & Recommendations

Page size can be reduced by 407.5 kB (69%)

Content Size

589.3 kB

After Optimization

181.7 kB

In fact, the total size of Jscexamresult.com main page is 589.3 kB. This result falls beyond the top 1M of websites and identifies a large and not optimized web page that may take ages to load. 30% of websites need less resources to load. Javascripts take 506.1 kB which makes up the majority of the site volume.

HTML Optimization

-73%

Potential reduce by 11.0 kB

  • Original 15.1 kB
  • After minification 13.7 kB
  • After compression 4.0 kB

HTML content can be minified and compressed by a website’s server. The most efficient way is to compress content using GZIP which reduces data amount travelling through the network between server and browser. HTML code on this page is well minified. It is highly recommended that content of this web page should be compressed using GZIP, as it can save up to 11.0 kB or 73% of the original size.

Image Optimization

-21%

Potential reduce by 4.0 kB

  • Original 19.2 kB
  • After minification 15.3 kB

Image size optimization can help to speed up a website loading time. The chart above shows the difference between the size before and after optimization. Obviously, Jscexamresult needs image optimization as it can save up to 4.0 kB or 21% of the original volume. The most popular and efficient tools for JPEG and PNG image optimization are Jpegoptim and PNG Crush.

JavaScript Optimization

-69%

Potential reduce by 350.7 kB

  • Original 506.1 kB
  • After minification 492.2 kB
  • After compression 155.4 kB

It’s better to minify JavaScript in order to improve website performance. The diagram shows the current total size of all JavaScript files against the prospective JavaScript size after its minification and compression. It is highly recommended that all JavaScript files should be compressed and minified as it can save up to 350.7 kB or 69% of the original size.

CSS Optimization

-86%

Potential reduce by 41.8 kB

  • Original 48.9 kB
  • After minification 35.3 kB
  • After compression 7.1 kB

CSS files minification is very important to reduce a web page rendering time. The faster CSS files can load, the earlier a page can be rendered. Jscexamresult.com needs all CSS files to be minified and compressed as it can save up to 41.8 kB or 86% of the original size.

Requests Breakdown

Number of requests can be reduced by 37 (80%)

Requests Now

46

After Optimization

9

The browser has sent 46 CSS, Javascripts, AJAX and image requests in order to completely render the main page of Jscexamresult. We recommend that multiple CSS and JavaScript files should be merged into one by each type, as it can help reduce assets requests from 15 to 1 for JavaScripts and from 9 to 1 for CSS and as a result speed up the page load time.

Accessibility Review

jscexamresult.com accessibility score

95

Accessibility Issues

Names and labels

These are opportunities to improve the semantics of the controls in your application. This may enhance the experience for users of assistive technology, like a screen reader.

Impact

Issue

High

Links do not have a discernible name

Best Practices

jscexamresult.com best practices score

67

Areas of Improvement

Trust and Safety

Impact

Issue

High

Does not use HTTPS

High

Includes front-end JavaScript libraries with known security vulnerabilities

Low

Ensure CSP is effective against XSS attacks

General

Impact

Issue

Low

Detected JavaScript libraries

High

Browser errors were logged to the console

SEO Factors

jscexamresult.com SEO score

73

Search Engine Optimization Advices

Language and Encoding

  • Language Detected

    N/A

  • Language Claimed

    EN

  • Encoding

    UTF-8

Language claimed in HTML meta tag should match the language actually used on the web page. Otherwise Jscexamresult.com can be misinterpreted by Google and other search engines. Unfortunately we cannot identify language used on the page (probably there is a mix of languages, too little text or something else), while the claimed language is English. Our system also found out that Jscexamresult.com main page’s claimed encoding is utf-8. Use of this encoding format is the best practice as the main page visitors from all over the world won’t have any issues with symbol transcription.

Social Sharing Optimization

Open Graph description is not detected on the main page of Jscexamresult. Lack of Open Graph description can be counter-productive for their social media presence, as such a description allows converting a website homepage (or other pages) into good-looking, rich and well-structured posts, when it is being shared on Facebook and other social media. For example, adding the following code snippet into HTML <head> tag will help to represent this web page correctly in social networks: