Report Summary

  • 8

    Performance

    Renders faster than
    22% of other websites

  • 69

    Accessibility

    Visual factors better than
    that of 35% of websites

  • 83

    Best Practices

    More advanced features
    available than in
    56% of websites

  • 84

    SEO

    Google-friendlier than
    53% of websites

loadproof.com

Avoid Freight Claims and Chargebacks in Your Warehouse | LoadProof

Page Load Speed

10.5 sec in total

First Response

30 ms

Resources Loaded

9.6 sec

Page Rendered

872 ms
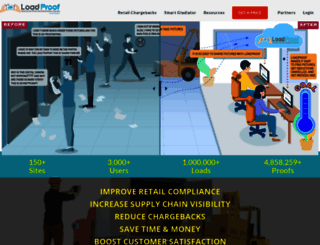
loadproof.com screenshot

About Website

Visit loadproof.com now to see the best up-to-date Load Proof content and also check out these interesting facts you probably never knew about loadproof.com

Avoid retail chargebacks, freight in a single click. Save more than 70% by using the LoadProof centralized photo documentation solution.

Visit loadproof.com

Key Findings

We analyzed Loadproof.com page load time and found that the first response time was 30 ms and then it took 10.5 sec to load all DOM resources and completely render a web page. This is a poor result, as 90% of websites can load faster.

Performance Metrics

loadproof.com performance score

8

Measured Metrics

name

value

score

weighting

FCP (First Contentful Paint)

Value6.7 s

2/100

10%

LCP (Largest Contentful Paint)

Value37.1 s

0/100

25%

SI (Speed Index)

Value27.1 s

0/100

10%

TBT (Total Blocking Time)

Value17,280 ms

0/100

30%

CLS (Cumulative Layout Shift)

Value0.245

51/100

15%

TTI (Time to Interactive)

Value46.4 s

0/100

10%

Network Requests Diagram

loadproof.com

30 ms

loadproof.com

59 ms

formidableforms.css

33 ms

dashicons.min.css

41 ms

style.min.css

44 ms

Our browser made a total of 302 requests to load all elements on the main page. We found that 49% of them (148 requests) were addressed to the original Loadproof.com, 29% (89 requests) were made to Fonts.gstatic.com and 8% (24 requests) were made to Youtube.com. The less responsive or slowest element that took the longest time to load (5.1 sec) belongs to the original domain Loadproof.com.

Page Optimization Overview & Recommendations

Page size can be reduced by 493.0 kB (14%)

Content Size

3.5 MB

After Optimization

3.0 MB

In fact, the total size of Loadproof.com main page is 3.5 MB. This result falls beyond the top 1M of websites and identifies a large and not optimized web page that may take ages to load. 85% of websites need less resources to load and that’s why Accessify’s recommendations for optimization and resource minification can be helpful for this project. Images take 2.8 MB which makes up the majority of the site volume.

HTML Optimization

-83%

Potential reduce by 173.9 kB

  • Original 209.3 kB
  • After minification 206.4 kB
  • After compression 35.4 kB

HTML content can be minified and compressed by a website’s server. The most efficient way is to compress content using GZIP which reduces data amount travelling through the network between server and browser. HTML code on this page is well minified. It is highly recommended that content of this web page should be compressed using GZIP, as it can save up to 173.9 kB or 83% of the original size.

Image Optimization

-11%

Potential reduce by 308.1 kB

  • Original 2.8 MB
  • After minification 2.5 MB

Image size optimization can help to speed up a website loading time. The chart above shows the difference between the size before and after optimization. Obviously, Load Proof needs image optimization as it can save up to 308.1 kB or 11% of the original volume. The most popular and efficient tools for JPEG and PNG image optimization are Jpegoptim and PNG Crush.

JavaScript Optimization

-3%

Potential reduce by 11.0 kB

  • Original 408.2 kB
  • After minification 408.2 kB
  • After compression 397.2 kB

It’s better to minify JavaScript in order to improve website performance. The diagram shows the current total size of all JavaScript files against the prospective JavaScript size after its minification and compression. This website has mostly compressed JavaScripts.

CSS Optimization

-0%

Potential reduce by 0 B

  • Original 58.9 kB
  • After minification 58.9 kB
  • After compression 58.9 kB

CSS files minification is very important to reduce a web page rendering time. The faster CSS files can load, the earlier a page can be rendered. Loadproof.com has all CSS files already compressed.

Requests Breakdown

Number of requests can be reduced by 103 (55%)

Requests Now

186

After Optimization

83

The browser has sent 186 CSS, Javascripts, AJAX and image requests in order to completely render the main page of Load Proof. We recommend that multiple CSS and JavaScript files should be merged into one by each type, as it can help reduce assets requests from 63 to 1 for JavaScripts and from 42 to 1 for CSS and as a result speed up the page load time.

Accessibility Review

loadproof.com accessibility score

69

Accessibility Issues

Names and labels

These are opportunities to improve the semantics of the controls in your application. This may enhance the experience for users of assistive technology, like a screen reader.

Impact

Issue

High

Buttons do not have an accessible name

High

Image elements do not have [alt] attributes

High

Links do not have a discernible name

Contrast

These are opportunities to improve the legibility of your content.

Impact

Issue

High

Background and foreground colors do not have a sufficient contrast ratio.

Navigation

These are opportunities to improve keyboard navigation in your application.

Impact

Issue

High

Heading elements are not in a sequentially-descending order

Best practices

These items highlight common accessibility best practices.

Impact

Issue

High

[user-scalable="no"] is used in the <meta name="viewport"> element or the [maximum-scale] attribute is less than 5.

Best Practices

loadproof.com best practices score

83

Areas of Improvement

Trust and Safety

Impact

Issue

High

Does not use HTTPS

Low

Ensure CSP is effective against XSS attacks

User Experience

Impact

Issue

High

Displays images with incorrect aspect ratio

General

Impact

Issue

Low

Detected JavaScript libraries

High

Page has valid source maps

SEO Factors

loadproof.com SEO score

84

Search Engine Optimization Advices

Crawling and Indexing

To appear in search results, crawlers need access to your app.

Impact

Issue

High

Links are not crawlable

Content Best Practices

Format your HTML in a way that enables crawlers to better understand your app’s content.

Impact

Issue

High

Image elements do not have [alt] attributes

Mobile Friendly

Make sure your pages are mobile friendly so users don’t have to pinch or zoom in order to read the content pages. [Learn more](https://developers.google.com/search/mobile-sites/).

Impact

Issue

High

Document uses legible font sizes

High

Tap targets are not sized appropriately

Language and Encoding

  • Language Detected

    EN

  • Language Claimed

    EN

  • Encoding

    UTF-8

Language claimed in HTML meta tag should match the language actually used on the web page. Otherwise Loadproof.com can be misinterpreted by Google and other search engines. Our service has detected that English is used on the page, and it matches the claimed language. Our system also found out that Loadproof.com main page’s claimed encoding is utf-8. Use of this encoding format is the best practice as the main page visitors from all over the world won’t have any issues with symbol transcription.

Social Sharing Optimization

Open Graph data is detected on the main page of Load Proof. This is the best way to make the web page social media friendly. Here is how it looks like on Facebook: