Report Summary

  • 25

    Performance

    Renders faster than
    44% of other websites

  • 99

    Accessibility

    Visual factors better than
    that of 97% of websites

  • 92

    Best Practices

    More advanced features
    available than in
    81% of websites

  • 92

    SEO

    Google-friendlier than
    75% of websites

luma.style

Handmade Bow Tie for Men | LUMA Bow Ties | organic, handmade and made in Berlin

Page Load Speed

4.7 sec in total

First Response

1.7 sec

Resources Loaded

2.9 sec

Page Rendered

67 ms
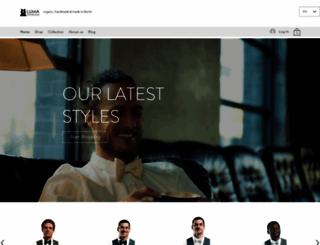
luma.style screenshot

About Website

Visit luma.style now to see the best up-to-date LUMA content and also check out these interesting facts you probably never knew about luma.style

LUMA bow ties: organic, handmade & made in Berlin. Our mission is to dress men with style with our unique bow ties yet simultaneously respect nature and people involved in the production.

Visit luma.style

Key Findings

We analyzed Luma.style page load time and found that the first response time was 1.7 sec and then it took 3 sec to load all DOM resources and completely render a web page. This is a poor result, as 55% of websites can load faster.

Performance Metrics

luma.style performance score

25

Measured Metrics

name

value

score

weighting

FCP (First Contentful Paint)

Value2.9 s

52/100

10%

LCP (Largest Contentful Paint)

Value6.7 s

8/100

25%

SI (Speed Index)

Value9.2 s

13/100

10%

TBT (Total Blocking Time)

Value3,040 ms

2/100

30%

CLS (Cumulative Layout Shift)

Value0

100/100

15%

TTI (Time to Interactive)

Value16.8 s

5/100

10%

Network Requests Diagram

www.luma.style

1666 ms

minified.js

52 ms

focus-within-polyfill.js

51 ms

polyfill.min.js

344 ms

thunderbolt-commons.1e70fbb2.bundle.min.js

63 ms

Our browser made a total of 35 requests to load all elements on the main page. We found that 3% of them (1 request) were addressed to the original Luma.style, 34% (12 requests) were made to Static.parastorage.com and 34% (12 requests) were made to Sentry-next.wixpress.com. The less responsive or slowest element that took the longest time to load (1.7 sec) belongs to the original domain Luma.style.

Page Optimization Overview & Recommendations

Page size can be reduced by 1.2 MB (71%)

Content Size

1.6 MB

After Optimization

464.9 kB

In fact, the total size of Luma.style main page is 1.6 MB. This result falls beyond the top 1M of websites and identifies a large and not optimized web page that may take ages to load. 25% of websites need less resources to load. HTML takes 1.3 MB which makes up the majority of the site volume.

HTML Optimization

-83%

Potential reduce by 1.1 MB

  • Original 1.3 MB
  • After minification 1.3 MB
  • After compression 226.9 kB

HTML content can be minified and compressed by a website’s server. The most efficient way is to compress content using GZIP which reduces data amount travelling through the network between server and browser. HTML code on this page is well minified. It is highly recommended that content of this web page should be compressed using GZIP, as it can save up to 1.1 MB or 83% of the original size.

Image Optimization

-0%

Potential reduce by 53 B

  • Original 24.9 kB
  • After minification 24.8 kB

Image size optimization can help to speed up a website loading time. The chart above shows the difference between the size before and after optimization. LUMA images are well optimized though.

JavaScript Optimization

-22%

Potential reduce by 59.3 kB

  • Original 272.5 kB
  • After minification 272.5 kB
  • After compression 213.2 kB

It’s better to minify JavaScript in order to improve website performance. The diagram shows the current total size of all JavaScript files against the prospective JavaScript size after its minification and compression. It is highly recommended that all JavaScript files should be compressed and minified as it can save up to 59.3 kB or 22% of the original size.

Requests Breakdown

Number of requests can be reduced by 10 (45%)

Requests Now

22

After Optimization

12

The browser has sent 22 CSS, Javascripts, AJAX and image requests in order to completely render the main page of LUMA. We recommend that multiple CSS and JavaScript files should be merged into one by each type, as it can help reduce assets requests from 11 to 1 for JavaScripts and as a result speed up the page load time.

Accessibility Review

luma.style accessibility score

99

Accessibility Issues

Navigation

These are opportunities to improve keyboard navigation in your application.

Impact

Issue

High

Heading elements are not in a sequentially-descending order

Best Practices

luma.style best practices score

92

Areas of Improvement

Trust and Safety

Impact

Issue

High

Does not use HTTPS

Low

Ensure CSP is effective against XSS attacks

General

Impact

Issue

Low

Detected JavaScript libraries

High

Page has valid source maps

SEO Factors

luma.style SEO score

92

Search Engine Optimization Advices

Content Best Practices

Format your HTML in a way that enables crawlers to better understand your app’s content.

Impact

Issue

High

Links do not have descriptive text

Mobile Friendly

Make sure your pages are mobile friendly so users don’t have to pinch or zoom in order to read the content pages. [Learn more](https://developers.google.com/search/mobile-sites/).

Impact

Issue

High

Document uses legible font sizes

High

Tap targets are not sized appropriately

Language and Encoding

  • Language Detected

    EN

  • Language Claimed

    EN

  • Encoding

    UTF-8

Language claimed in HTML meta tag should match the language actually used on the web page. Otherwise Luma.style can be misinterpreted by Google and other search engines. Our service has detected that English is used on the page, and it matches the claimed language. Our system also found out that Luma.style main page’s claimed encoding is utf-8. Use of this encoding format is the best practice as the main page visitors from all over the world won’t have any issues with symbol transcription.

Social Sharing Optimization

Open Graph data is detected on the main page of PARSED_DOMAIN, but there is no image specified in description. It would be a good idea for the website admin to select a nice image that can properly represent the website in Open Graph data, otherwise the first found image will be taken for this purpose and social media information block will look like this: