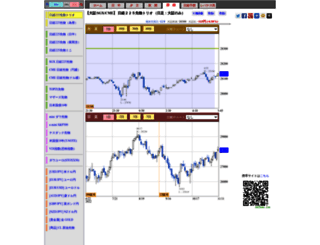
7.3 sec in total
552 ms
6.6 sec
105 ms
Click here to check amazing N 225 Chart content for Japan. Otherwise, check out these important facts you probably never knew about n225chart.com
日経225先物(日経トリオ)のリアルタイムチャートです。5分足と日足が同時に見れます。
Visit n225chart.comWe analyzed N225chart.com page load time and found that the first response time was 552 ms and then it took 6.7 sec to load all DOM resources and completely render a web page. This is a poor result, as 80% of websites can load faster.
n225chart.com performance score
name
value
score
weighting
Value3.3 s
41/100
10%
Value4.2 s
45/100
25%
Value8.2 s
20/100
10%
Value3,470 ms
2/100
30%
Value0.013
100/100
15%
Value13.6 s
11/100
10%
552 ms
720 ms
176 ms
894 ms
349 ms
Our browser made a total of 40 requests to load all elements on the main page. We found that 25% of them (10 requests) were addressed to the original N225chart.com, 25% (10 requests) were made to Omt.shinobi.jp and 13% (5 requests) were made to Googleads.g.doubleclick.net. The less responsive or slowest element that took the longest time to load (1.3 sec) relates to the external source Omt.shinobi.jp.
Page size can be reduced by 55.7 kB (54%)
102.6 kB
46.9 kB
In fact, the total size of N225chart.com main page is 102.6 kB. This result falls beyond the top 1M of websites and identifies a large and not optimized web page that may take ages to load. 20% of websites need less resources to load. HTML takes 38.6 kB which makes up the majority of the site volume.
Potential reduce by 30.1 kB
HTML content can be minified and compressed by a website’s server. The most efficient way is to compress content using GZIP which reduces data amount travelling through the network between server and browser. HTML code on this page is well minified. It is highly recommended that content of this web page should be compressed using GZIP, as it can save up to 30.1 kB or 78% of the original size.
Potential reduce by 9 B
Image size optimization can help to speed up a website loading time. The chart above shows the difference between the size before and after optimization. N 225 Chart images are well optimized though.
Potential reduce by 2.0 kB
It’s better to minify JavaScript in order to improve website performance. The diagram shows the current total size of all JavaScript files against the prospective JavaScript size after its minification and compression. This website has mostly compressed JavaScripts.
Potential reduce by 23.5 kB
CSS files minification is very important to reduce a web page rendering time. The faster CSS files can load, the earlier a page can be rendered. N225chart.com needs all CSS files to be minified and compressed as it can save up to 23.5 kB or 84% of the original size.
Number of requests can be reduced by 16 (48%)
33
17
The browser has sent 33 CSS, Javascripts, AJAX and image requests in order to completely render the main page of N 225 Chart. We recommend that multiple CSS and JavaScript files should be merged into one by each type, as it can help reduce assets requests from 11 to 1 for JavaScripts and as a result speed up the page load time.
n225chart.com
552 ms
n225chart.com
720 ms
menu_bar.css
176 ms
yoso.html
894 ms
symbol.lst
349 ms
adsbygoogle.js
67 ms
footer.dat
526 ms
qrcode.gif
352 ms
index_5min.html
231 ms
index_day.html
333 ms
zrt_lookup.html
25 ms
show_ads_impl.js
88 ms
ads
945 ms
2ada74523834b1df85d9b1fa44d0a236
1346 ms
ads
635 ms
index_5min.dat
525 ms
index_day.dat
735 ms
ga.js
16 ms
__utm.gif
10 ms
ninja_onetag.css
170 ms
tsumugi
338 ms
pv
501 ms
ads
590 ms
__utm.gif
23 ms
twitter_tweet_ninja_m.png
379 ms
facebook_share_ninja_m.png
303 ms
google_plusone_ninja_m.png
354 ms
hatena_ninja_m.png
468 ms
mixi_check_ninja_m.png
528 ms
ninja_icon_m.png
554 ms
ads
1278 ms
fire
174 ms
control
854 ms
reactive_library.js
120 ms
multi
164 ms
track
171 ms
first.js
168 ms
2736
328 ms
set
686 ms
cookiesync
1035 ms
n225chart.com accessibility score
ARIA
These are opportunities to improve the usage of ARIA in your application which may enhance the experience for users of assistive technology, like a screen reader.
Impact
Issue
[aria-*] attributes do not match their roles
Contrast
These are opportunities to improve the legibility of your content.
Impact
Issue
Background and foreground colors do not have a sufficient contrast ratio.
Names and labels
These are opportunities to improve the semantics of the controls in your application. This may enhance the experience for users of assistive technology, like a screen reader.
Impact
Issue
<frame> or <iframe> elements do not have a title
Image elements do not have [alt] attributes
Links do not have a discernible name
Internationalization and localization
These are opportunities to improve the interpretation of your content by users in different locales.
Impact
Issue
<html> element does not have a [lang] attribute
n225chart.com best practices score
Trust and Safety
Impact
Issue
Does not use HTTPS
Ensure CSP is effective against XSS attacks
User Experience
Impact
Issue
Serves images with low resolution
General
Impact
Issue
Browser errors were logged to the console
Page has valid source maps
n225chart.com SEO score
Crawling and Indexing
To appear in search results, crawlers need access to your app.
Impact
Issue
Links are not crawlable
Content Best Practices
Format your HTML in a way that enables crawlers to better understand your app’s content.
Impact
Issue
Image elements do not have [alt] attributes
JA
N/A
SHIFT_JIS
Language claimed in HTML meta tag should match the language actually used on the web page. Otherwise N225chart.com can be misinterpreted by Google and other search engines. Our service has detected that Japanese is used on the page, and neither this language nor any other was claimed in <html> or <meta> tags. Our system also found out that N225chart.com main page’s claimed encoding is shift_jis. Changing it to UTF-8 can be a good choice, as this format is commonly used for encoding all over the web and thus their visitors won’t have any troubles with symbol transcription or reading.
n225chart.com
Open Graph description is not detected on the main page of N 225 Chart. Lack of Open Graph description can be counter-productive for their social media presence, as such a description allows converting a website homepage (or other pages) into good-looking, rich and well-structured posts, when it is being shared on Facebook and other social media. For example, adding the following code snippet into HTML <head> tag will help to represent this web page correctly in social networks: