Report Summary

  • 47

    Performance

    Renders faster than
    66% of other websites

  • 79

    Accessibility

    Visual factors better than
    that of 48% of websites

  • 75

    Best Practices

    More advanced features
    available than in
    35% of websites

  • 78

    SEO

    Google-friendlier than
    39% of websites

navikagawa.com

香川県の地域情報サイト - 香川県の事業者情報を無料で掲載【なび香川】

Page Load Speed

5.6 sec in total

First Response

397 ms

Resources Loaded

4.5 sec

Page Rendered

728 ms
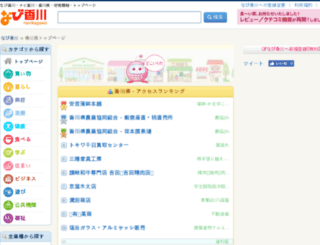
navikagawa.com screenshot

About Website

Click here to check amazing Navikagawa content for Japan. Otherwise, check out these important facts you probably never knew about navikagawa.com

香川県の地域情報サイト『なび香川』は利用者の皆さんがより良い事業者を見つける為に香川県の事業者情報を無料で掲載。地元のビジネスを支援します。

Visit navikagawa.com

Key Findings

We analyzed Navikagawa.com page load time and found that the first response time was 397 ms and then it took 5.2 sec to load all DOM resources and completely render a web page. This is a poor result, as 75% of websites can load faster.

Performance Metrics

navikagawa.com performance score

47

Measured Metrics

name

value

score

weighting

FCP (First Contentful Paint)

Value2.7 s

60/100

10%

LCP (Largest Contentful Paint)

Value2.7 s

86/100

25%

SI (Speed Index)

Value7.8 s

23/100

10%

TBT (Total Blocking Time)

Value2,190 ms

6/100

30%

CLS (Cumulative Layout Shift)

Value0.093

91/100

15%

TTI (Time to Interactive)

Value12.5 s

14/100

10%

Network Requests Diagram

navikagawa.com

397 ms

navikagawa.com

1962 ms

bootstrap-reboot.min.css

60 ms

font-awesome.min.css

69 ms

style_responsive.css

200 ms

Our browser made a total of 62 requests to load all elements on the main page. We found that 56% of them (35 requests) were addressed to the original Navikagawa.com, 5% (3 requests) were made to Cdnjs.cloudflare.com and 5% (3 requests) were made to Pagead2.googlesyndication.com. The less responsive or slowest element that took the longest time to load (2 sec) belongs to the original domain Navikagawa.com.

Page Optimization Overview & Recommendations

Page size can be reduced by 240.3 kB (18%)

Content Size

1.3 MB

After Optimization

1.1 MB

In fact, the total size of Navikagawa.com main page is 1.3 MB. This result falls beyond the top 1M of websites and identifies a large and not optimized web page that may take ages to load. 65% of websites need less resources to load. Images take 650.9 kB which makes up the majority of the site volume.

HTML Optimization

-79%

Potential reduce by 76.0 kB

  • Original 95.6 kB
  • After minification 77.1 kB
  • After compression 19.6 kB

HTML content can be minified and compressed by a website’s server. The most efficient way is to compress content using GZIP which reduces data amount travelling through the network between server and browser. This page needs HTML code to be minified as it can gain 18.5 kB, which is 19% of the original size. It is highly recommended that content of this web page should be compressed using GZIP, as it can save up to 76.0 kB or 79% of the original size.

Image Optimization

-3%

Potential reduce by 22.8 kB

  • Original 650.9 kB
  • After minification 628.1 kB

Image size optimization can help to speed up a website loading time. The chart above shows the difference between the size before and after optimization. Navikagawa images are well optimized though.

JavaScript Optimization

-25%

Potential reduce by 129.0 kB

  • Original 521.6 kB
  • After minification 521.6 kB
  • After compression 392.6 kB

It’s better to minify JavaScript in order to improve website performance. The diagram shows the current total size of all JavaScript files against the prospective JavaScript size after its minification and compression. It is highly recommended that all JavaScript files should be compressed and minified as it can save up to 129.0 kB or 25% of the original size.

CSS Optimization

-39%

Potential reduce by 12.5 kB

  • Original 32.1 kB
  • After minification 32.1 kB
  • After compression 19.6 kB

CSS files minification is very important to reduce a web page rendering time. The faster CSS files can load, the earlier a page can be rendered. Navikagawa.com needs all CSS files to be minified and compressed as it can save up to 12.5 kB or 39% of the original size.

Requests Breakdown

Number of requests can be reduced by 41 (69%)

Requests Now

59

After Optimization

18

The browser has sent 59 CSS, Javascripts, AJAX and image requests in order to completely render the main page of Navikagawa. We recommend that multiple CSS and JavaScript files should be merged into one by each type, as it can help reduce assets requests from 16 to 1 for JavaScripts and from 5 to 1 for CSS and as a result speed up the page load time.

Accessibility Review

navikagawa.com accessibility score

79

Accessibility Issues

Contrast

These are opportunities to improve the legibility of your content.

Impact

Issue

High

Background and foreground colors do not have a sufficient contrast ratio.

Names and labels

These are opportunities to improve the semantics of the controls in your application. This may enhance the experience for users of assistive technology, like a screen reader.

Impact

Issue

High

Image elements do not have [alt] attributes

Best practices

These items highlight common accessibility best practices.

Impact

Issue

High

[user-scalable="no"] is used in the <meta name="viewport"> element or the [maximum-scale] attribute is less than 5.

Best Practices

navikagawa.com best practices score

75

Areas of Improvement

Trust and Safety

Impact

Issue

High

Does not use HTTPS

High

Includes front-end JavaScript libraries with known security vulnerabilities

Low

Ensure CSP is effective against XSS attacks

User Experience

Impact

Issue

High

Serves images with low resolution

General

Impact

Issue

Low

Detected JavaScript libraries

High

Page has valid source maps

SEO Factors

navikagawa.com SEO score

78

Search Engine Optimization Advices

Crawling and Indexing

To appear in search results, crawlers need access to your app.

Impact

Issue

High

Links are not crawlable

High

robots.txt is not valid

Content Best Practices

Format your HTML in a way that enables crawlers to better understand your app’s content.

Impact

Issue

High

Image elements do not have [alt] attributes

Mobile Friendly

Make sure your pages are mobile friendly so users don’t have to pinch or zoom in order to read the content pages. [Learn more](https://developers.google.com/search/mobile-sites/).

Impact

Issue

High

Document uses legible font sizes

High

Tap targets are not sized appropriately

Language and Encoding

  • Language Detected

    JA

  • Language Claimed

    JA

  • Encoding

    UTF-8

Language claimed in HTML meta tag should match the language actually used on the web page. Otherwise Navikagawa.com can be misinterpreted by Google and other search engines. Our service has detected that Japanese is used on the page, and it matches the claimed language. Our system also found out that Navikagawa.com main page’s claimed encoding is utf-8. Use of this encoding format is the best practice as the main page visitors from all over the world won’t have any issues with symbol transcription.

Social Sharing Optimization

Open Graph data is detected on the main page of Navikagawa. This is the best way to make the web page social media friendly. Here is how it looks like on Facebook: