2 sec in total
98 ms
1.7 sec
170 ms
Visit noproblemconstruction.com now to see the best up-to-date No Problem Construction content and also check out these interesting facts you probably never knew about noproblemconstruction.com
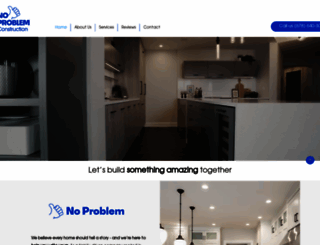
No Problem Construction! We believe every home should tell a story - and we’re here to help you write yours. As a family-driven company rooted in Atlanta, we combine more than 18 years of experience w...
Visit noproblemconstruction.comWe analyzed Noproblemconstruction.com page load time and found that the first response time was 98 ms and then it took 1.9 sec to load all DOM resources and completely render a web page. This is quite a good result, as only 40% of websites can load faster.
noproblemconstruction.com performance score
98 ms
29 ms
44 ms
36 ms
62 ms
Our browser made a total of 69 requests to load all elements on the main page. We found that 3% of them (2 requests) were addressed to the original Noproblemconstruction.com, 32% (22 requests) were made to Img4.wsimg.com and 13% (9 requests) were made to Nebula.wsimg.com. The less responsive or slowest element that took the longest time to load (476 ms) relates to the external source Nebula.wsimg.com.
Page size can be reduced by 733.8 kB (63%)
1.2 MB
424.7 kB
In fact, the total size of Noproblemconstruction.com main page is 1.2 MB. This result falls beyond the top 1M of websites and identifies a large and not optimized web page that may take ages to load. 60% of websites need less resources to load. Javascripts take 799.4 kB which makes up the majority of the site volume.
Potential reduce by 178.4 kB
HTML content can be minified and compressed by a website’s server. The most efficient way is to compress content using GZIP which reduces data amount travelling through the network between server and browser. HTML code on this page is well minified. It is highly recommended that content of this web page should be compressed using GZIP, as it can save up to 178.4 kB or 76% of the original size.
Potential reduce by 633 B
Image size optimization can help to speed up a website loading time. The chart above shows the difference between the size before and after optimization. No Problem Construction images are well optimized though.
Potential reduce by 518.0 kB
It’s better to minify JavaScript in order to improve website performance. The diagram shows the current total size of all JavaScript files against the prospective JavaScript size after its minification and compression. It is highly recommended that all JavaScript files should be compressed and minified as it can save up to 518.0 kB or 65% of the original size.
Potential reduce by 36.7 kB
CSS files minification is very important to reduce a web page rendering time. The faster CSS files can load, the earlier a page can be rendered. Noproblemconstruction.com needs all CSS files to be minified and compressed as it can save up to 36.7 kB or 64% of the original size.
Number of requests can be reduced by 42 (67%)
63
21
The browser has sent 63 CSS, Javascripts, AJAX and image requests in order to completely render the main page of No Problem Construction. We recommend that multiple CSS and JavaScript files should be merged into one by each type, as it can help reduce assets requests from 34 to 1 for JavaScripts and from 5 to 1 for CSS and as a result speed up the page load time.
www.noproblemconstruction.com
98 ms
css
29 ms
css
44 ms
site.css
36 ms
duel.js
62 ms
addthis_widget.js
13 ms
jq.js
315 ms
media.lightbox.js
307 ms
social.share.js
285 ms
media.gallery.js
283 ms
subscribe.published.js
296 ms
9714937b8d69af5652156cc204231c38
265 ms
cookiemanager.js
269 ms
iebackground.js
321 ms
layers.e5ea973510bf60b3db41.js
95 ms
300lo.json
108 ms
subscribe-sprite.png
159 ms
guC5lwT5Dw7anV_xfpCGqw.ttf
100 ms
URSgP3aplSko3CQAzdXHwPesZW2xOQ-xsNqO47m55DA.ttf
101 ms
jk7b-Al_6RLn0YQzwF_1-fesZW2xOQ-xsNqO47m55DA.ttf
101 ms
sh.8e5f85691f9aaa082472a194.html
98 ms
util.window.js
35 ms
util.instances.js
35 ms
util.model.js
36 ms
documentHelper.js
35 ms
helper.js
36 ms
2225
56 ms
fancybox.js
54 ms
regexhelper.js
60 ms
growl.js
59 ms
jquery.watermark.js
65 ms
5b7be4c4a6209aca71712dc234361615
294 ms
browser.js
27 ms
wsb-slideshow-arrows.png
79 ms
fancybox.css
72 ms
sf.core.pkg.js
78 ms
pixel
33 ms
app.css
52 ms
659c55439f26d080ada942235ba666c8
453 ms
9a1310effa8e02ffb9cf666bd813d5ef
334 ms
4cdbffa3eb211b41d182bf84a703415d
432 ms
333ea80cd3a4ae781cc48099d1ad20bf
395 ms
pixel
19 ms
all.js&version=v2.0
201 ms
widgets.js
79 ms
plusone.js
48 ms
cb=gapi.loaded_0
60 ms
cb=gapi.loaded_1
84 ms
fastbutton
118 ms
button.0308b81ff1714e446f674b5b9793f2cd.js
176 ms
aa3d15d4d718065afd51ee1da720ac39
259 ms
46419a6ed68c496b523ebb49a8293889
243 ms
4729714ecd9d99e77427e543432b5031
476 ms
postmessageRelay
86 ms
cb=gapi.loaded_0
111 ms
cb=gapi.loaded_1
66 ms
W5F8_SL0XFawnjxHGsZjJA.ttf
101 ms
195 ms
3193398744-postmessagerelay.js
50 ms
rpc:shindig_random.js
48 ms
xd_arbiter.php
99 ms
xd_arbiter.php
180 ms
tweet_button.b9740740e0bcf9b0657c5b11bd4388da.en.html
64 ms
cb=gapi.loaded_0
53 ms
jot
100 ms
ping
55 ms
like.php
103 ms
qeKvIRsJabD.js
150 ms
LVx-xkvaJ0b.png
163 ms
noproblemconstruction.com SEO score
![]()
EN
![]()
EN
UTF-8
Language claimed in HTML meta tag should match the language actually used on the web page. Otherwise Noproblemconstruction.com can be misinterpreted by Google and other search engines. Our service has detected that English is used on the page, and it matches the claimed language. Our system also found out that Noproblemconstruction.com main page’s claimed encoding is utf-8. Use of this encoding format is the best practice as the main page visitors from all over the world won’t have any issues with symbol transcription.
noproblemconstruction.com
Open Graph data is detected on the main page of No Problem Construction. This is the best way to make the web page social media friendly. Here is how it looks like on Facebook: