Report Summary

  • 97

    Performance

    Renders faster than
    95% of other websites

  • 62

    Accessibility

    Visual factors better than
    that of 28% of websites

  • 75

    Best Practices

    More advanced features
    available than in
    36% of websites

  • 54

    SEO

    Google-friendlier than
    19% of websites

web2.nazca.co.jp

無料ホームページのレンタル ナスカ

Page Load Speed

4.2 sec in total

First Response

693 ms

Resources Loaded

3.4 sec

Page Rendered

131 ms
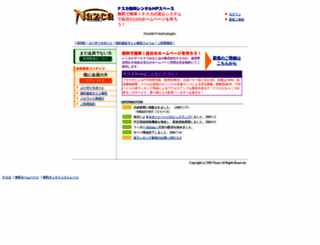
web2.nazca.co.jp screenshot

About Website

Click here to check amazing Web 2 Nazca content for Japan. Otherwise, check out these important facts you probably never knew about web2.nazca.co.jp

無料のレンタルホームページスペース。国内の法人が運営し、質の高いコンテンツが充実。広告掲載や商用利用も自由。

Visit web2.nazca.co.jp

Key Findings

We analyzed Web2.nazca.co.jp page load time and found that the first response time was 693 ms and then it took 3.5 sec to load all DOM resources and completely render a web page. This is a poor result, as 60% of websites can load faster.

Performance Metrics

web2.nazca.co.jp performance score

97

Measured Metrics

name

value

score

weighting

FCP (First Contentful Paint)

Value1.9 s

86/100

10%

LCP (Largest Contentful Paint)

Value1.9 s

97/100

25%

SI (Speed Index)

Value3.4 s

89/100

10%

TBT (Total Blocking Time)

Value20 ms

100/100

30%

CLS (Cumulative Layout Shift)

Value0.015

100/100

15%

TTI (Time to Interactive)

Value2.0 s

99/100

10%

Network Requests Diagram

web2.nazca.co.jp

693 ms

home.js

393 ms

nazcaweb.css

391 ms

yads.js

566 ms

a1022317.js

361 ms

Our browser made a total of 42 requests to load all elements on the main page. We found that 45% of them (19 requests) were addressed to the original Web2.nazca.co.jp, 21% (9 requests) were made to Yads.yahoo.co.jp and 10% (4 requests) were made to I.yimg.jp. The less responsive or slowest element that took the longest time to load (2.3 sec) relates to the external source Ip1.10clicks.com.

Page Optimization Overview & Recommendations

Page size can be reduced by 82.2 kB (63%)

Content Size

129.8 kB

After Optimization

47.5 kB

In fact, the total size of Web2.nazca.co.jp main page is 129.8 kB. This result falls beyond the top 1M of websites and identifies a large and not optimized web page that may take ages to load. 15% of websites need less resources to load. Javascripts take 93.5 kB which makes up the majority of the site volume.

HTML Optimization

-76%

Potential reduce by 14.7 kB

  • Original 19.4 kB
  • After minification 19.2 kB
  • After compression 4.7 kB

HTML content can be minified and compressed by a website’s server. The most efficient way is to compress content using GZIP which reduces data amount travelling through the network between server and browser. HTML code on this page is well minified. It is highly recommended that content of this web page should be compressed using GZIP, as it can save up to 14.7 kB or 76% of the original size.

Image Optimization

-0%

Potential reduce by 0 B

  • Original 16.4 kB
  • After minification 16.4 kB

Image size optimization can help to speed up a website loading time. The chart above shows the difference between the size before and after optimization. Web 2 Nazca images are well optimized though.

JavaScript Optimization

-72%

Potential reduce by 67.3 kB

  • Original 93.5 kB
  • After minification 93.2 kB
  • After compression 26.2 kB

It’s better to minify JavaScript in order to improve website performance. The diagram shows the current total size of all JavaScript files against the prospective JavaScript size after its minification and compression. It is highly recommended that all JavaScript files should be compressed and minified as it can save up to 67.3 kB or 72% of the original size.

CSS Optimization

-56%

Potential reduce by 228 B

  • Original 407 B
  • After minification 326 B
  • After compression 179 B

CSS files minification is very important to reduce a web page rendering time. The faster CSS files can load, the earlier a page can be rendered. Web2.nazca.co.jp needs all CSS files to be minified and compressed as it can save up to 228 B or 56% of the original size.

Requests Breakdown

Number of requests can be reduced by 29 (71%)

Requests Now

41

After Optimization

12

The browser has sent 41 CSS, Javascripts, AJAX and image requests in order to completely render the main page of Web 2 Nazca. We recommend that multiple CSS and JavaScript files should be merged into one by each type, as it can help reduce assets requests from 15 to 1 for JavaScripts and as a result speed up the page load time.

Accessibility Review

web2.nazca.co.jp accessibility score

62

Accessibility Issues

Contrast

These are opportunities to improve the legibility of your content.

Impact

Issue

High

Background and foreground colors do not have a sufficient contrast ratio.

Names and labels

These are opportunities to improve the semantics of the controls in your application. This may enhance the experience for users of assistive technology, like a screen reader.

Impact

Issue

High

<frame> or <iframe> elements do not have a title

High

Image elements do not have [alt] attributes

High

<object> elements do not have alternate text

Best Practices

web2.nazca.co.jp best practices score

75

Areas of Improvement

Trust and Safety

Impact

Issue

High

Does not use HTTPS

Low

Ensure CSP is effective against XSS attacks

User Experience

Impact

Issue

High

Serves images with low resolution

SEO Factors

web2.nazca.co.jp SEO score

54

Search Engine Optimization Advices

Content Best Practices

Format your HTML in a way that enables crawlers to better understand your app’s content.

Impact

Issue

High

Image elements do not have [alt] attributes

High

Document uses plugins

Language and Encoding

  • Language Detected

    JA

  • Language Claimed

    JA

  • Encoding

    SHIFT_JIS

Language claimed in HTML meta tag should match the language actually used on the web page. Otherwise Web2.nazca.co.jp can be misinterpreted by Google and other search engines. Our service has detected that Japanese is used on the page, and it matches the claimed language. Our system also found out that Web2.nazca.co.jp main page’s claimed encoding is shift_jis. Changing it to UTF-8 can be a good choice, as this format is commonly used for encoding all over the web and thus their visitors won’t have any troubles with symbol transcription or reading.

Social Sharing Optimization

Open Graph description is not detected on the main page of Web 2 Nazca. Lack of Open Graph description can be counter-productive for their social media presence, as such a description allows converting a website homepage (or other pages) into good-looking, rich and well-structured posts, when it is being shared on Facebook and other social media. For example, adding the following code snippet into HTML <head> tag will help to represent this web page correctly in social networks: