Report Summary

  • 21

    Performance

    Renders faster than
    38% of other websites

  • 100

    Accessibility

    Visual factors better than
    that of 97% of websites

  • 83

    Best Practices

    More advanced features
    available than in
    55% of websites

  • 93

    SEO

    Google-friendlier than
    83% of websites

opentable.ae

Restaurants and Restaurant Bookings | OpenTable

Page Load Speed

3.1 sec in total

First Response

780 ms

Resources Loaded

2 sec

Page Rendered

386 ms
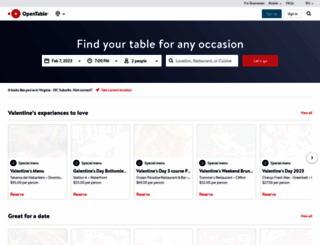
opentable.ae screenshot

About Website

Visit opentable.ae now to see the best up-to-date Open Table content for United States and also check out these interesting facts you probably never knew about opentable.ae

Book online, read restaurant reviews from diners, and earn points towards free meals. OpenTable is a real-time online booking network for fine dining restaurants.

Visit opentable.ae

Key Findings

We analyzed Opentable.ae page load time and found that the first response time was 780 ms and then it took 2.3 sec to load all DOM resources and completely render a web page. This is quite a good result, as only 45% of websites can load faster.

Performance Metrics

opentable.ae performance score

21

Measured Metrics

name

value

score

weighting

FCP (First Contentful Paint)

Value3.5 s

35/100

10%

LCP (Largest Contentful Paint)

Value16.8 s

0/100

25%

SI (Speed Index)

Value8.6 s

17/100

10%

TBT (Total Blocking Time)

Value3,480 ms

2/100

30%

CLS (Cumulative Layout Shift)

Value0.09

92/100

15%

TTI (Time to Interactive)

Value13.2 s

12/100

10%

Network Requests Diagram

www.opentable.ae

780 ms

home-7f883d03c64140b68eaa.css

203 ms

otSDKStub.js

49 ms

320db0d2

54 ms

373919be-b194-4250-a731-b25b3470a97a.json

80 ms

Our browser made a total of 21 requests to load all elements on the main page. We found that 10% of them (2 requests) were addressed to the original Opentable.ae, 76% (16 requests) were made to Cdn.otstatic.com and 10% (2 requests) were made to Cdn.cookielaw.org. The less responsive or slowest element that took the longest time to load (780 ms) belongs to the original domain Opentable.ae.

Page Optimization Overview & Recommendations

Page size can be reduced by 53.0 kB (41%)

Content Size

128.4 kB

After Optimization

75.4 kB

In fact, the total size of Opentable.ae main page is 128.4 kB. This result falls beyond the top 1M of websites and identifies a large and not optimized web page that may take ages to load. 20% of websites need less resources to load. HTML takes 68.1 kB which makes up the majority of the site volume.

HTML Optimization

-78%

Potential reduce by 53.0 kB

  • Original 68.1 kB
  • After minification 67.9 kB
  • After compression 15.1 kB

HTML content can be minified and compressed by a website’s server. The most efficient way is to compress content using GZIP which reduces data amount travelling through the network between server and browser. HTML code on this page is well minified. It is highly recommended that content of this web page should be compressed using GZIP, as it can save up to 53.0 kB or 78% of the original size.

Image Optimization

-0%

Potential reduce by 0 B

  • Original 19.7 kB
  • After minification 19.7 kB

Image size optimization can help to speed up a website loading time. The chart above shows the difference between the size before and after optimization. Open Table images are well optimized though.

JavaScript Optimization

-0%

Potential reduce by 22 B

  • Original 16.0 kB
  • After minification 16.0 kB
  • After compression 16.0 kB

It’s better to minify JavaScript in order to improve website performance. The diagram shows the current total size of all JavaScript files against the prospective JavaScript size after its minification and compression. This website has mostly compressed JavaScripts.

CSS Optimization

-0%

Potential reduce by 0 B

  • Original 24.6 kB
  • After minification 24.6 kB
  • After compression 24.6 kB

CSS files minification is very important to reduce a web page rendering time. The faster CSS files can load, the earlier a page can be rendered. Opentable.ae has all CSS files already compressed.

Requests Breakdown

We found no issues to fix!

Requests Now

17

After Optimization

17

The browser has sent 17 CSS, Javascripts, AJAX and image requests in order to completely render the main page of Open Table. According to our analytics all requests are already optimized.

Accessibility Review

opentable.ae accessibility score

100

Accessibility Issues

Best Practices

opentable.ae best practices score

83

Areas of Improvement

Trust and Safety

Impact

Issue

High

Does not use HTTPS

Low

Ensure CSP is effective against XSS attacks

User Experience

Impact

Issue

High

Serves images with low resolution

SEO Factors

opentable.ae SEO score

93

Search Engine Optimization Advices

Content Best Practices

Format your HTML in a way that enables crawlers to better understand your app’s content.

Impact

Issue

High

Links do not have descriptive text

Mobile Friendly

Make sure your pages are mobile friendly so users don’t have to pinch or zoom in order to read the content pages. [Learn more](https://developers.google.com/search/mobile-sites/).

Impact

Issue

High

Document uses legible font sizes

Language and Encoding

  • Language Detected

    EN

  • Language Claimed

    EN

  • Encoding

    UTF-8

Language claimed in HTML meta tag should match the language actually used on the web page. Otherwise Opentable.ae can be misinterpreted by Google and other search engines. Our service has detected that English is used on the page, and it matches the claimed language. Our system also found out that Opentable.ae main page’s claimed encoding is utf-8. Use of this encoding format is the best practice as the main page visitors from all over the world won’t have any issues with symbol transcription.

Social Sharing Optimization

Open Graph data is detected on the main page of Open Table. This is the best way to make the web page social media friendly. Here is how it looks like on Facebook: