Report Summary

  • 0

    Performance

  • 0

    Accessibility

  • 0

    Best Practices

  • 0

    SEO

Page Load Speed

958 ms in total

First Response

368 ms

Resources Loaded

449 ms

Page Rendered

141 ms
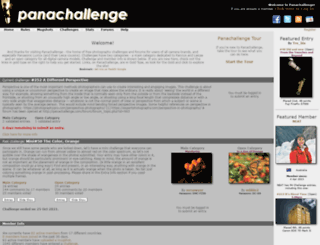
panachallenge.com screenshot

About Website

Visit panachallenge.com now to see the best up-to-date Panachallenge content for Israel and also check out these interesting facts you probably never knew about panachallenge.com

Panachallenge - the home of free photography challenges and forums for all camera brands, and especially Panasonic Lumix (and their Leica cousins). Challenges have two categories - a main category ded...

Visit panachallenge.com

Key Findings

We analyzed Panachallenge.com page load time and found that the first response time was 368 ms and then it took 590 ms to load all DOM resources and completely render a web page. This is quite a good result, as only 10% of websites can load faster.

Performance Metrics

panachallenge.com performance score

0

Network Requests Diagram

panachallenge.com

368 ms

styles.css

57 ms

scripts.js

57 ms

urchin.js

5 ms

__utm.gif

6 ms

Our browser made a total of 20 requests to load all elements on the main page. We found that 85% of them (17 requests) were addressed to the original Panachallenge.com, 10% (2 requests) were made to Google-analytics.com and 5% (1 request) were made to Widgets.twimg.com. The less responsive or slowest element that took the longest time to load (368 ms) belongs to the original domain Panachallenge.com.

Page Optimization Overview & Recommendations

Page size can be reduced by 35.5 kB (35%)

Content Size

102.8 kB

After Optimization

67.3 kB

In fact, the total size of Panachallenge.com main page is 102.8 kB. This result falls beyond the top 1M of websites and identifies a large and not optimized web page that may take ages to load. Only 10% of websites need less resources to load. Images take 55.3 kB which makes up the majority of the site volume.

HTML Optimization

-80%

Potential reduce by 17.7 kB

  • Original 22.1 kB
  • After minification 20.9 kB
  • After compression 4.4 kB

HTML content can be minified and compressed by a website’s server. The most efficient way is to compress content using GZIP which reduces data amount travelling through the network between server and browser. HTML code on this page is well minified. It is highly recommended that content of this web page should be compressed using GZIP, as it can save up to 17.7 kB or 80% of the original size.

Image Optimization

-4%

Potential reduce by 2.0 kB

  • Original 55.3 kB
  • After minification 53.2 kB

Image size optimization can help to speed up a website loading time. The chart above shows the difference between the size before and after optimization. Panachallenge images are well optimized though.

JavaScript Optimization

-50%

Potential reduce by 8.9 kB

  • Original 17.6 kB
  • After minification 15.3 kB
  • After compression 8.8 kB

It’s better to minify JavaScript in order to improve website performance. The diagram shows the current total size of all JavaScript files against the prospective JavaScript size after its minification and compression. It is highly recommended that all JavaScript files should be compressed and minified as it can save up to 8.9 kB or 50% of the original size.

CSS Optimization

-88%

Potential reduce by 6.9 kB

  • Original 7.9 kB
  • After minification 6.8 kB
  • After compression 946 B

CSS files minification is very important to reduce a web page rendering time. The faster CSS files can load, the earlier a page can be rendered. Panachallenge.com needs all CSS files to be minified and compressed as it can save up to 6.9 kB or 88% of the original size.

Requests Breakdown

We found no issues to fix!

Requests Now

19

After Optimization

19

The browser has sent 19 CSS, Javascripts, AJAX and image requests in order to completely render the main page of Panachallenge. According to our analytics all requests are already optimized.

SEO Factors

panachallenge.com SEO score

0

Language and Encoding

  • Language Detected

    N/A

  • Language Claimed

    N/A

  • Encoding

    N/A

Language claimed in HTML meta tag should match the language actually used on the web page. Otherwise Panachallenge.com can be misinterpreted by Google and other search engines. Unfortunately we cannot identify language used on the page (probably there is a mix of languages, too little text or something else) and no language is claimed in <html> or <meta> tags either. Our system also found out that Panachallenge.com main page’s claimed encoding is . Changing it to UTF-8 can be a good choice, as this format is commonly used for encoding all over the web and thus their visitors won’t have any troubles with symbol transcription or reading.

Social Sharing Optimization

Open Graph description is not detected on the main page of Panachallenge. Lack of Open Graph description can be counter-productive for their social media presence, as such a description allows converting a website homepage (or other pages) into good-looking, rich and well-structured posts, when it is being shared on Facebook and other social media. For example, adding the following code snippet into HTML <head> tag will help to represent this web page correctly in social networks: