Report Summary

  • 10

    Performance

    Renders faster than
    23% of other websites

  • 53

    Accessibility

    Visual factors better than
    that of 22% of websites

  • 75

    Best Practices

    More advanced features
    available than in
    35% of websites

  • 82

    SEO

    Google-friendlier than
    44% of websites

panu.com.my

Pan Uniform Manufacturing Sdn Bhd - Uniform Manufacturer & Supplier in Johor Bahru JB Malaysia.

Page Load Speed

11.9 sec in total

First Response

1.2 sec

Resources Loaded

10.4 sec

Page Rendered

284 ms

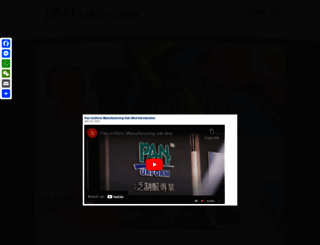
panu.com.my screenshot

About Website

Welcome to panu.com.my homepage info - get ready to check Pan U best content right away, or after learning these important things about panu.com.my

Custom Made & Ready Made Uniform Manufacturer, Uniform Design, Uniform Supplier in Johor Bahru (JB), Malaysia.

Visit panu.com.my

Key Findings

We analyzed Panu.com.my page load time and found that the first response time was 1.2 sec and then it took 10.7 sec to load all DOM resources and completely render a web page. This is a poor result, as 90% of websites can load faster.

Performance Metrics

panu.com.my performance score

10

Measured Metrics

name

value

score

weighting

FCP (First Contentful Paint)

Value8.1 s

0/100

10%

LCP (Largest Contentful Paint)

Value23.4 s

0/100

25%

SI (Speed Index)

Value18.5 s

0/100

10%

TBT (Total Blocking Time)

Value1,790 ms

10/100

30%

CLS (Cumulative Layout Shift)

Value0.254

49/100

15%

TTI (Time to Interactive)

Value23.2 s

1/100

10%

Network Requests Diagram

panu.com.my

1196 ms

www.panu.com.my

1313 ms

font-awesome.css

58 ms

style.css

808 ms

general_v1.css

1268 ms

Our browser made a total of 85 requests to load all elements on the main page. We found that 5% of them (4 requests) were addressed to the original Panu.com.my, 66% (56 requests) were made to Cdn1.npcdn.net and 7% (6 requests) were made to Youtube.com. The less responsive or slowest element that took the longest time to load (5.5 sec) relates to the external source Cdn1.npcdn.net.

Page Optimization Overview & Recommendations

Page size can be reduced by 52.8 kB (2%)

Content Size

2.7 MB

After Optimization

2.7 MB

In fact, the total size of Panu.com.my main page is 2.7 MB. This result falls beyond the top 1M of websites and identifies a large and not optimized web page that may take ages to load. 80% of websites need less resources to load and that’s why Accessify’s recommendations for optimization and resource minification can be helpful for this project. Images take 2.2 MB which makes up the majority of the site volume.

HTML Optimization

-76%

Potential reduce by 38.5 kB

  • Original 50.8 kB
  • After minification 49.5 kB
  • After compression 12.3 kB

HTML content can be minified and compressed by a website’s server. The most efficient way is to compress content using GZIP which reduces data amount travelling through the network between server and browser. HTML code on this page is well minified. It is highly recommended that content of this web page should be compressed using GZIP, as it can save up to 38.5 kB or 76% of the original size.

Image Optimization

-0%

Potential reduce by 666 B

  • Original 2.2 MB
  • After minification 2.2 MB

Image size optimization can help to speed up a website loading time. The chart above shows the difference between the size before and after optimization. Pan U images are well optimized though.

JavaScript Optimization

-3%

Potential reduce by 11.4 kB

  • Original 398.9 kB
  • After minification 398.8 kB
  • After compression 387.5 kB

It’s better to minify JavaScript in order to improve website performance. The diagram shows the current total size of all JavaScript files against the prospective JavaScript size after its minification and compression. This website has mostly compressed JavaScripts.

CSS Optimization

-2%

Potential reduce by 2.3 kB

  • Original 108.7 kB
  • After minification 108.7 kB
  • After compression 106.5 kB

CSS files minification is very important to reduce a web page rendering time. The faster CSS files can load, the earlier a page can be rendered. Panu.com.my has all CSS files already compressed.

Requests Breakdown

Number of requests can be reduced by 42 (55%)

Requests Now

77

After Optimization

35

The browser has sent 77 CSS, Javascripts, AJAX and image requests in order to completely render the main page of Pan U. We recommend that multiple CSS and JavaScript files should be merged into one by each type, as it can help reduce assets requests from 23 to 1 for JavaScripts and from 21 to 1 for CSS and as a result speed up the page load time.

Accessibility Review

panu.com.my accessibility score

53

Accessibility Issues

Names and labels

These are opportunities to improve the semantics of the controls in your application. This may enhance the experience for users of assistive technology, like a screen reader.

Impact

Issue

High

Buttons do not have an accessible name

High

<frame> or <iframe> elements do not have a title

High

Image elements do not have [alt] attributes

High

Links do not have a discernible name

Contrast

These are opportunities to improve the legibility of your content.

Impact

Issue

High

Background and foreground colors do not have a sufficient contrast ratio.

Navigation

These are opportunities to improve keyboard navigation in your application.

Impact

Issue

High

[id] attributes on active, focusable elements are not unique

Internationalization and localization

These are opportunities to improve the interpretation of your content by users in different locales.

Impact

Issue

High

<html> element does not have a [lang] attribute

Tables and lists

These are opportunities to improve the experience of reading tabular or list data using assistive technology, like a screen reader.

Impact

Issue

High

Lists do not contain only <li> elements and script supporting elements (<script> and <template>).

Best practices

These items highlight common accessibility best practices.

Impact

Issue

High

[user-scalable="no"] is used in the <meta name="viewport"> element or the [maximum-scale] attribute is less than 5.

Best Practices

panu.com.my best practices score

75

Areas of Improvement

Trust and Safety

Impact

Issue

High

Does not use HTTPS

High

Includes front-end JavaScript libraries with known security vulnerabilities

Low

Ensure CSP is effective against XSS attacks

General

Impact

Issue

Low

Detected JavaScript libraries

High

Browser errors were logged to the console

High

Page has valid source maps

SEO Factors

panu.com.my SEO score

82

Search Engine Optimization Advices

Crawling and Indexing

To appear in search results, crawlers need access to your app.

Impact

Issue

High

Links are not crawlable

Content Best Practices

Format your HTML in a way that enables crawlers to better understand your app’s content.

Impact

Issue

High

Image elements do not have [alt] attributes

Mobile Friendly

Make sure your pages are mobile friendly so users don’t have to pinch or zoom in order to read the content pages. [Learn more](https://developers.google.com/search/mobile-sites/).

Impact

Issue

High

Document uses legible font sizes

High

Tap targets are not sized appropriately

Language and Encoding

  • Language Detected

    EN

  • Language Claimed

    N/A

  • Encoding

    GB2312

Language claimed in HTML meta tag should match the language actually used on the web page. Otherwise Panu.com.my can be misinterpreted by Google and other search engines. Our service has detected that English is used on the page, and neither this language nor any other was claimed in <html> or <meta> tags. Our system also found out that Panu.com.my main page’s claimed encoding is gb2312. Changing it to UTF-8 can be a good choice, as this format is commonly used for encoding all over the web and thus their visitors won’t have any troubles with symbol transcription or reading.

Social Sharing Optimization

Open Graph data is detected on the main page of Pan U. This is the best way to make the web page social media friendly. Here is how it looks like on Facebook: