Report Summary

  • 29

    Performance

    Renders faster than
    49% of other websites

  • 65

    Accessibility

    Visual factors better than
    that of 31% of websites

  • 50

    Best Practices

    More advanced features
    available than in
    18% of websites

  • 62

    SEO

    Google-friendlier than
    22% of websites

pfblog.com

PFBlog: The Personal Finance Blog Since 2003 | Everything About Saving, Investing and Spending Wisely

Page Load Speed

3 sec in total

First Response

753 ms

Resources Loaded

1.1 sec

Page Rendered

1.1 sec

pfblog.com screenshot

About Website

Visit pfblog.com now to see the best up-to-date PFBlog content for United States and also check out these interesting facts you probably never knew about pfblog.com

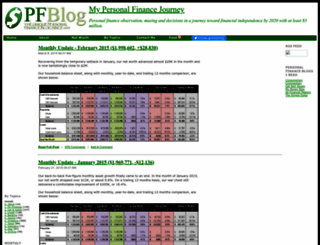
Personal finance observation, musing and decisions in a journey toward financial independence by 36 with at least $1 million.

Visit pfblog.com

Key Findings

We analyzed Pfblog.com page load time and found that the first response time was 753 ms and then it took 2.2 sec to load all DOM resources and completely render a web page. This is quite a good result, as only 40% of websites can load faster.

Performance Metrics

pfblog.com performance score

29

Measured Metrics

name

value

score

weighting

FCP (First Contentful Paint)

Value1.4 s

97/100

10%

LCP (Largest Contentful Paint)

Value5.6 s

17/100

25%

SI (Speed Index)

Value13.4 s

2/100

10%

TBT (Total Blocking Time)

Value32,270 ms

0/100

30%

CLS (Cumulative Layout Shift)

Value0.001

100/100

15%

TTI (Time to Interactive)

Value43.8 s

0/100

10%

Network Requests Diagram

pfblog.com

753 ms

aaa-stylesheet.css

93 ms

aaa-cssmenu.css

94 ms

new-stylesheet.css

93 ms

feed-icon.gif

143 ms

Our browser made a total of 49 requests to load all elements on the main page. We found that 41% of them (20 requests) were addressed to the original Pfblog.com, 10% (5 requests) were made to Googleads.g.doubleclick.net and 10% (5 requests) were made to Tpc.googlesyndication.com. The less responsive or slowest element that took the longest time to load (753 ms) belongs to the original domain Pfblog.com.

Page Optimization Overview & Recommendations

Page size can be reduced by 258.3 kB (15%)

Content Size

1.7 MB

After Optimization

1.5 MB

In fact, the total size of Pfblog.com main page is 1.7 MB. This result falls beyond the top 1M of websites and identifies a large and not optimized web page that may take ages to load. 50% of websites need less resources to load. Images take 1.6 MB which makes up the majority of the site volume.

HTML Optimization

-77%

Potential reduce by 52.8 kB

  • Original 68.2 kB
  • After minification 65.2 kB
  • After compression 15.5 kB

HTML content can be minified and compressed by a website’s server. The most efficient way is to compress content using GZIP which reduces data amount travelling through the network between server and browser. HTML code on this page is well minified. It is highly recommended that content of this web page should be compressed using GZIP, as it can save up to 52.8 kB or 77% of the original size.

Image Optimization

-11%

Potential reduce by 181.3 kB

  • Original 1.6 MB
  • After minification 1.4 MB

Image size optimization can help to speed up a website loading time. The chart above shows the difference between the size before and after optimization. Obviously, PFBlog needs image optimization as it can save up to 181.3 kB or 11% of the original volume. The most popular and efficient tools for JPEG and PNG image optimization are Jpegoptim and PNG Crush.

JavaScript Optimization

-37%

Potential reduce by 17.4 kB

  • Original 46.6 kB
  • After minification 44.6 kB
  • After compression 29.2 kB

It’s better to minify JavaScript in order to improve website performance. The diagram shows the current total size of all JavaScript files against the prospective JavaScript size after its minification and compression. It is highly recommended that all JavaScript files should be compressed and minified as it can save up to 17.4 kB or 37% of the original size.

CSS Optimization

-75%

Potential reduce by 6.8 kB

  • Original 9.1 kB
  • After minification 7.1 kB
  • After compression 2.2 kB

CSS files minification is very important to reduce a web page rendering time. The faster CSS files can load, the earlier a page can be rendered. Pfblog.com needs all CSS files to be minified and compressed as it can save up to 6.8 kB or 75% of the original size.

Requests Breakdown

Number of requests can be reduced by 17 (39%)

Requests Now

44

After Optimization

27

The browser has sent 44 CSS, Javascripts, AJAX and image requests in order to completely render the main page of PFBlog. We recommend that multiple CSS and JavaScript files should be merged into one by each type, as it can help reduce assets requests from 11 to 1 for JavaScripts and as a result speed up the page load time.

Accessibility Review

pfblog.com accessibility score

65

Accessibility Issues

ARIA

These are opportunities to improve the usage of ARIA in your application which may enhance the experience for users of assistive technology, like a screen reader.

Impact

Issue

High

[aria-*] attributes do not match their roles

Contrast

These are opportunities to improve the legibility of your content.

Impact

Issue

High

Background and foreground colors do not have a sufficient contrast ratio.

Names and labels

These are opportunities to improve the semantics of the controls in your application. This may enhance the experience for users of assistive technology, like a screen reader.

Impact

Issue

High

<frame> or <iframe> elements do not have a title

High

Image elements do not have [alt] attributes

High

Links do not have a discernible name

Navigation

These are opportunities to improve keyboard navigation in your application.

Impact

Issue

High

Heading elements are not in a sequentially-descending order

Best Practices

pfblog.com best practices score

50

Areas of Improvement

Trust and Safety

Impact

Issue

High

Does not use HTTPS

Low

Ensure CSP is effective against XSS attacks

User Experience

Impact

Issue

High

Displays images with incorrect aspect ratio

High

Serves images with low resolution

General

Impact

Issue

High

Browser errors were logged to the console

High

Page has valid source maps

SEO Factors

pfblog.com SEO score

62

Search Engine Optimization Advices

Crawling and Indexing

To appear in search results, crawlers need access to your app.

Impact

Issue

High

Links are not crawlable

Content Best Practices

Format your HTML in a way that enables crawlers to better understand your app’s content.

Impact

Issue

High

Image elements do not have [alt] attributes

Language and Encoding

  • Language Detected

    EN

  • Language Claimed

    N/A

  • Encoding

    UTF-8

Language claimed in HTML meta tag should match the language actually used on the web page. Otherwise Pfblog.com can be misinterpreted by Google and other search engines. Our service has detected that English is used on the page, and neither this language nor any other was claimed in <html> or <meta> tags. Our system also found out that Pfblog.com main page’s claimed encoding is utf-8. Use of this encoding format is the best practice as the main page visitors from all over the world won’t have any issues with symbol transcription.

Social Sharing Optimization

Open Graph description is not detected on the main page of PFBlog. Lack of Open Graph description can be counter-productive for their social media presence, as such a description allows converting a website homepage (or other pages) into good-looking, rich and well-structured posts, when it is being shared on Facebook and other social media. For example, adding the following code snippet into HTML <head> tag will help to represent this web page correctly in social networks: