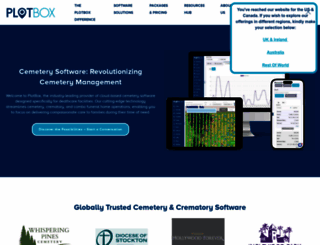
10.3 sec in total
296 ms
9 sec
965 ms
Welcome to plotbox.io homepage info - get ready to check Plot Box best content for United States right away, or after learning these important things about plotbox.io
Cemetery management software that enables death care facility operations. Fully integrated software and true digital mapping solve long standing problems
Visit plotbox.ioWe analyzed Plotbox.io page load time and found that the first response time was 296 ms and then it took 10 sec to load all DOM resources and completely render a web page. This is a poor result, as 90% of websites can load faster.
plotbox.io performance score
name
value
score
weighting
Value4.0 s
23/100
10%
Value40.4 s
0/100
25%
Value22.1 s
0/100
10%
Value7,650 ms
0/100
30%
Value0.295
40/100
15%
Value46.1 s
0/100
10%
296 ms
121 ms
400 ms
468 ms
241 ms
Our browser made a total of 105 requests to load all elements on the main page. We found that 29% of them (30 requests) were addressed to the original Plotbox.io, 15% (16 requests) were made to Youtube.com and 5% (5 requests) were made to Cdn2.hubspot.net. The less responsive or slowest element that took the longest time to load (1.6 sec) belongs to the original domain Plotbox.io.
Page size can be reduced by 844.0 kB (15%)
5.5 MB
4.6 MB
In fact, the total size of Plotbox.io main page is 5.5 MB. This result falls beyond the top 1M of websites and identifies a large and not optimized web page that may take ages to load. 85% of websites need less resources to load and that’s why Accessify’s recommendations for optimization and resource minification can be helpful for this project. Images take 4.7 MB which makes up the majority of the site volume.
Potential reduce by 159.2 kB
HTML content can be minified and compressed by a website’s server. The most efficient way is to compress content using GZIP which reduces data amount travelling through the network between server and browser. HTML code on this page is well minified. It is highly recommended that content of this web page should be compressed using GZIP, as it can save up to 159.2 kB or 83% of the original size.
Potential reduce by 340.3 kB
Image size optimization can help to speed up a website loading time. The chart above shows the difference between the size before and after optimization. Plot Box images are well optimized though.
Potential reduce by 24.6 kB
It’s better to minify JavaScript in order to improve website performance. The diagram shows the current total size of all JavaScript files against the prospective JavaScript size after its minification and compression. It is highly recommended that all JavaScript files should be compressed and minified as it can save up to 24.6 kB or 17% of the original size.
Potential reduce by 319.9 kB
CSS files minification is very important to reduce a web page rendering time. The faster CSS files can load, the earlier a page can be rendered. Plotbox.io needs all CSS files to be minified and compressed as it can save up to 319.9 kB or 74% of the original size.
Number of requests can be reduced by 58 (61%)
95
37
The browser has sent 95 CSS, Javascripts, AJAX and image requests in order to completely render the main page of Plot Box. We recommend that multiple CSS and JavaScript files should be merged into one by each type, as it can help reduce assets requests from 40 to 1 for JavaScripts and from 11 to 1 for CSS and as a result speed up the page load time.
www.plotbox.io
296 ms
jquery-1.7.1.js
121 ms
module_6513288775.min.css
400 ms
module_6491278853.min.css
468 ms
module_5648992195.min.css
241 ms
js
787 ms
layout.min.css
779 ms
Launch_Styles-1477581141770.min.css
238 ms
Plotbox_March2018-style.min.css
464 ms
font-awesome.min.css
604 ms
jquery-ui.js
784 ms
current.js
396 ms
widgets.js
1147 ms
jquery.colorbox-min.js
462 ms
Plotbox_March2018-main.js
460 ms
project.js
523 ms
project.js
522 ms
v2.js
1014 ms
wow.js
872 ms
module_5648992195.min.js
873 ms
1589093.js
873 ms
index.js
737 ms
fbevents.js
715 ms
et27s47p68zy.js
1155 ms
gtm.js
441 ms
css
672 ms
css
817 ms
font-awesome.css
671 ms
js
399 ms
analytics.js
793 ms
hotjar-2952853.js
767 ms
js
318 ms
363366014145665
564 ms
PlotBox-Logo-Transparent%20(2).png
741 ms
down-arrow.png
434 ms
f7f2f9a7-450b-41ba-8a31-27356215919c.png
602 ms
conversion_async.js
421 ms
ccb4f727-cf33-45c2-8b79-4d5c0b18ae57.png
490 ms
40b13034-4680-47b4-887d-d7a8aa2c5bde.png
879 ms
bb216e49-c3ae-4670-ab07-bee7e627ae9e.png
879 ms
6a4d8922-eaba-4665-b850-8544c4cb8a31.png
863 ms
PlotBox%20Reversed%20Logo.jpg
59 ms
TEST%202%20HOMEPAGE%20B%20BANNER.png
1625 ms
Screen%20Shot%202018-11-28%20at%2016.37.04.png
1628 ms
CRM%20Activities%20Screen.png
160 ms
Customer%20Logos%20for%20Website%20-%20August%202022.png
475 ms
As%20Featured%20In.png
165 ms
icon-map-blue.png
210 ms
icon-mail-blue.png
342 ms
blob.png
475 ms
blob-3.png
469 ms
blob-1.png
860 ms
9IprFzcBH1k
691 ms
proxima_nova_regular-webfont.woff
410 ms
proximanova-light-webfont.woff
410 ms
collect
78 ms
satYJNfbrT4
542 ms
9nEZWZnUeaM
539 ms
modules.61e17720cf639c3e96a7.js
734 ms
collect
782 ms
-wRTcLyhYbc
515 ms
656120854867215
579 ms
894 ms
tweet_button.f47a2e0b4471326b6fa0f163bda46011.en.html
393 ms
json
261 ms
insight.min.js
609 ms
9IprFzcBH1k
465 ms
satYJNfbrT4
464 ms
9nEZWZnUeaM
462 ms
-wRTcLyhYbc
461 ms
tweet_button.f47a2e0b4471326b6fa0f163bda46011.en.html
490 ms
widget_iframe.7dae38096d06923d683a2a807172322a.html
596 ms
1589093.js
467 ms
leadflows.js
529 ms
conversations-embed.js
422 ms
1589093.js
511 ms
box-69edcc3187336f9b0a3fbb4c73be9fe6.html
464 ms
1366754696820536
311 ms
ga-audiences
224 ms
form-dropdown-arrow.png
253 ms
www-player.css
231 ms
www-embed-player.js
229 ms
base.js
1036 ms
fetch-polyfill.js
91 ms
87 ms
jot
950 ms
settings
1400 ms
visit-data
1497 ms
ad_status.js
360 ms
id
254 ms
Y-zeT9jJ33tCNYTX0Kw8-3I-ogsAM9wZgys9W8554e8.js
137 ms
embed.js
33 ms
horizon_timeline.a7991bb824d62c8d5038ddd875db8389.js
1214 ms
embeds
1211 ms
WmYtwbYsvJeTDmsuIOmqRAOrqYQ4FznKv6GQB7SOtoo.js
1099 ms
Create
862 ms
Create
1002 ms
Create
983 ms
Create
1014 ms
KFOmCnqEu92Fr1Mu4mxPKTU1Kg.ttf
284 ms
KFOlCnqEu92Fr1MmEU9fBBc9AMP6lQ.ttf
294 ms
log_event
239 ms
log_event
1285 ms
log_event
1268 ms
483 ms
plotbox.io accessibility score
Contrast
These are opportunities to improve the legibility of your content.
Impact
Issue
Background and foreground colors do not have a sufficient contrast ratio.
Names and labels
These are opportunities to improve the semantics of the controls in your application. This may enhance the experience for users of assistive technology, like a screen reader.
Impact
Issue
<frame> or <iframe> elements do not have a title
plotbox.io best practices score
Trust and Safety
Impact
Issue
Does not use HTTPS
Includes front-end JavaScript libraries with known security vulnerabilities
Ensure CSP is effective against XSS attacks
User Experience
Impact
Issue
Displays images with incorrect aspect ratio
General
Impact
Issue
Detected JavaScript libraries
Missing source maps for large first-party JavaScript
plotbox.io SEO score
Content Best Practices
Format your HTML in a way that enables crawlers to better understand your app’s content.
Impact
Issue
Links do not have descriptive text
Crawling and Indexing
To appear in search results, crawlers need access to your app.
Impact
Issue
Links are not crawlable
Mobile Friendly
Make sure your pages are mobile friendly so users don’t have to pinch or zoom in order to read the content pages. [Learn more](https://developers.google.com/search/mobile-sites/).
Impact
Issue
Document uses legible font sizes
EN
EN
UTF-8
Language claimed in HTML meta tag should match the language actually used on the web page. Otherwise Plotbox.io can be misinterpreted by Google and other search engines. Our service has detected that English is used on the page, and it matches the claimed language. Our system also found out that Plotbox.io main page’s claimed encoding is utf-8. Use of this encoding format is the best practice as the main page visitors from all over the world won’t have any issues with symbol transcription.
plotbox.io
Open Graph data is detected on the main page of Plot Box. This is the best way to make the web page social media friendly. Here is how it looks like on Facebook: