Report Summary

  • 34

    Performance

    Renders faster than
    54% of other websites

  • 83

    Accessibility

    Visual factors better than
    that of 55% of websites

  • 83

    Best Practices

    More advanced features
    available than in
    56% of websites

  • 78

    SEO

    Google-friendlier than
    40% of websites

pschr.com

Plastic Surgery Center of Hampton Roads - PSCHR

Page Load Speed

1.2 sec in total

First Response

206 ms

Resources Loaded

698 ms

Page Rendered

296 ms
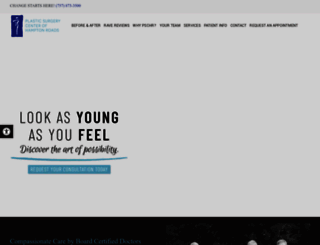
pschr.com screenshot

About Website

Welcome to pschr.com homepage info - get ready to check PSCHR best content right away, or after learning these important things about pschr.com

The Plastic Surgery Center of Hampton Roads is the number one choice for cosmetic surgery in Hampton Roads. Call us (757) 873-3500

Visit pschr.com

Key Findings

We analyzed Pschr.com page load time and found that the first response time was 206 ms and then it took 994 ms to load all DOM resources and completely render a web page. This is quite a good result, as only 20% of websites can load faster.

Performance Metrics

pschr.com performance score

34

Measured Metrics

name

value

score

weighting

FCP (First Contentful Paint)

Value3.2 s

44/100

10%

LCP (Largest Contentful Paint)

Value9.5 s

0/100

25%

SI (Speed Index)

Value6.6 s

37/100

10%

TBT (Total Blocking Time)

Value720 ms

41/100

30%

CLS (Cumulative Layout Shift)

Value0.141

78/100

15%

TTI (Time to Interactive)

Value10.6 s

23/100

10%

Network Requests Diagram

pschr.com

206 ms

dd952.css

31 ms

jquery.js

135 ms

jquery-migrate.min.js

57 ms

external-tracking.min.js

58 ms

Our browser made a total of 44 requests to load all elements on the main page. We found that 70% of them (31 requests) were addressed to the original Pschr.com, 14% (6 requests) were made to Dev.visualwebsiteoptimizer.com and 5% (2 requests) were made to Google-analytics.com. The less responsive or slowest element that took the longest time to load (313 ms) belongs to the original domain Pschr.com.

Page Optimization Overview & Recommendations

Page size can be reduced by 397.4 kB (25%)

Content Size

1.6 MB

After Optimization

1.2 MB

In fact, the total size of Pschr.com main page is 1.6 MB. This result falls beyond the top 1M of websites and identifies a large and not optimized web page that may take ages to load. 55% of websites need less resources to load. Images take 1.0 MB which makes up the majority of the site volume.

HTML Optimization

-76%

Potential reduce by 34.3 kB

  • Original 44.9 kB
  • After minification 42.0 kB
  • After compression 10.6 kB

HTML content can be minified and compressed by a website’s server. The most efficient way is to compress content using GZIP which reduces data amount travelling through the network between server and browser. HTML code on this page is well minified. It is highly recommended that content of this web page should be compressed using GZIP, as it can save up to 34.3 kB or 76% of the original size.

Image Optimization

-0%

Potential reduce by 227 B

  • Original 1.0 MB
  • After minification 1.0 MB

Image size optimization can help to speed up a website loading time. The chart above shows the difference between the size before and after optimization. PSCHR images are well optimized though.

JavaScript Optimization

-66%

Potential reduce by 293.4 kB

  • Original 447.0 kB
  • After minification 378.8 kB
  • After compression 153.6 kB

It’s better to minify JavaScript in order to improve website performance. The diagram shows the current total size of all JavaScript files against the prospective JavaScript size after its minification and compression. It is highly recommended that all JavaScript files should be compressed and minified as it can save up to 293.4 kB or 66% of the original size.

CSS Optimization

-80%

Potential reduce by 69.4 kB

  • Original 87.3 kB
  • After minification 85.9 kB
  • After compression 17.9 kB

CSS files minification is very important to reduce a web page rendering time. The faster CSS files can load, the earlier a page can be rendered. Pschr.com needs all CSS files to be minified and compressed as it can save up to 69.4 kB or 80% of the original size.

Requests Breakdown

Number of requests can be reduced by 17 (49%)

Requests Now

35

After Optimization

18

The browser has sent 35 CSS, Javascripts, AJAX and image requests in order to completely render the main page of PSCHR. We recommend that multiple CSS and JavaScript files should be merged into one by each type, as it can help reduce assets requests from 18 to 1 for JavaScripts and as a result speed up the page load time.

Accessibility Review

pschr.com accessibility score

83

Accessibility Issues

Contrast

These are opportunities to improve the legibility of your content.

Impact

Issue

High

Background and foreground colors do not have a sufficient contrast ratio.

Navigation

These are opportunities to improve keyboard navigation in your application.

Impact

Issue

High

Heading elements are not in a sequentially-descending order

High

Some elements have a [tabindex] value greater than 0

Names and labels

These are opportunities to improve the semantics of the controls in your application. This may enhance the experience for users of assistive technology, like a screen reader.

Impact

Issue

High

Image elements do not have [alt] attributes

High

Links do not have a discernible name

Tables and lists

These are opportunities to improve the experience of reading tabular or list data using assistive technology, like a screen reader.

Impact

Issue

High

Lists do not contain only <li> elements and script supporting elements (<script> and <template>).

Best Practices

pschr.com best practices score

83

Areas of Improvement

Trust and Safety

Impact

Issue

High

Does not use HTTPS

Low

Ensure CSP is effective against XSS attacks

General

Impact

Issue

Low

Detected JavaScript libraries

High

Browser errors were logged to the console

SEO Factors

pschr.com SEO score

78

Search Engine Optimization Advices

Content Best Practices

Format your HTML in a way that enables crawlers to better understand your app’s content.

Impact

Issue

High

Links do not have descriptive text

High

Image elements do not have [alt] attributes

Crawling and Indexing

To appear in search results, crawlers need access to your app.

Impact

Issue

High

Links are not crawlable

Mobile Friendly

Make sure your pages are mobile friendly so users don’t have to pinch or zoom in order to read the content pages. [Learn more](https://developers.google.com/search/mobile-sites/).

Impact

Issue

High

Document uses legible font sizes

High

Tap targets are not sized appropriately

Language and Encoding

  • Language Detected

    EN

  • Language Claimed

    EN

  • Encoding

    UTF-8

Language claimed in HTML meta tag should match the language actually used on the web page. Otherwise Pschr.com can be misinterpreted by Google and other search engines. Our service has detected that English is used on the page, and it matches the claimed language. Our system also found out that Pschr.com main page’s claimed encoding is utf-8. Use of this encoding format is the best practice as the main page visitors from all over the world won’t have any issues with symbol transcription.

Social Sharing Optimization

Open Graph data is detected on the main page of PSCHR. This is the best way to make the web page social media friendly. Here is how it looks like on Facebook: