13.4 sec in total
662 ms
12 sec
756 ms
Welcome to qtccolor.com homepage info - get ready to check Qtccolor best content for China right away, or after learning these important things about qtccolor.com
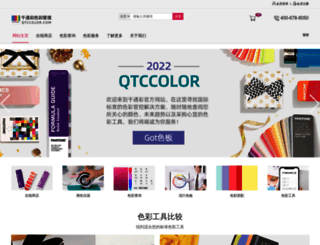
色卡品牌店现货供应PANTONE潘通色卡,劳尔RAL色卡,国际标准色卡及标准光源对色灯箱相关色彩仪器,涵盖印刷、纺织、塑胶、绘图、数码科技等领域,潘通色标卡帮助众多行业提供国际统一标准色彩语言,色彩爱好者可在线一键查询色号.
Visit qtccolor.comWe analyzed Qtccolor.com page load time and found that the first response time was 662 ms and then it took 12.7 sec to load all DOM resources and completely render a web page. This is a poor result, as 90% of websites can load faster.
qtccolor.com performance score
662 ms
849 ms
1304 ms
1573 ms
2359 ms
Our browser made a total of 69 requests to load all elements on the main page. We found that 4% of them (3 requests) were addressed to the original Qtccolor.com, 84% (58 requests) were made to Cdn.qtccolor.com and 7% (5 requests) were made to Cdn-newpcshop.qtccolor.com. The less responsive or slowest element that took the longest time to load (4.2 sec) relates to the external source Cdn.qtccolor.com.
Page size can be reduced by 73.5 kB (3%)
2.9 MB
2.9 MB
In fact, the total size of Qtccolor.com main page is 2.9 MB. This result falls beyond the top 1M of websites and identifies a large and not optimized web page that may take ages to load. 40% of websites need less resources to load. Images take 2.2 MB which makes up the majority of the site volume.
Potential reduce by 35.7 kB
HTML content can be minified and compressed by a website’s server. The most efficient way is to compress content using GZIP which reduces data amount travelling through the network between server and browser. HTML code on this page is well minified. It is highly recommended that content of this web page should be compressed using GZIP, as it can save up to 35.7 kB or 75% of the original size.
Potential reduce by 34.3 kB
Image size optimization can help to speed up a website loading time. The chart above shows the difference between the size before and after optimization. Qtccolor images are well optimized though.
Potential reduce by 140 B
It’s better to minify JavaScript in order to improve website performance. The diagram shows the current total size of all JavaScript files against the prospective JavaScript size after its minification and compression. This website has mostly compressed JavaScripts.
Potential reduce by 3.4 kB
CSS files minification is very important to reduce a web page rendering time. The faster CSS files can load, the earlier a page can be rendered. Qtccolor.com has all CSS files already compressed.
Number of requests can be reduced by 4 (6%)
65
61
The browser has sent 65 CSS, Javascripts, AJAX and image requests in order to completely render the main page of Qtccolor. We recommend that multiple CSS and JavaScript files should be merged into one by each type, as it can help reduce assets requests from 5 to 1 for JavaScripts and as a result speed up the page load time.
qtccolor.com
662 ms
www.qtccolor.com
849 ms
www.qtccolor.com
1304 ms
index.css
1573 ms
tailwind.min.css
2359 ms
hm.js
1218 ms
3f5672f.css
363 ms
a7d170a.js
125 ms
0642c62.js
152 ms
2059ebc.js
151 ms
9f9f8e2.js
183 ms
hm.gif
308 ms
logo.png
597 ms
RAL-K7.jpg
1102 ms
2022-%E9%A9%AC%E5%85%8B%E6%9D%AF%E8%B5%A0%E9%80%81-PC.jpg
2085 ms
CALIBRITE-banner-pc.jpg
1632 ms
%E5%9C%A8%E7%BA%BF%E5%95%86%E5%BA%97.png
788 ms
%E7%81%AF%E7%AE%B1%E4%BB%AA%E5%99%A8.png
1892 ms
%E8%89%B2%E5%BD%A9%E6%9F%A5%E8%AF%A2.png
1002 ms
%E8%89%B2%E5%BD%A9%E6%9C%8D%E5%8A%A1.png
1878 ms
%E8%89%B2%E5%BD%A9%E6%90%AD%E9%85%8D.png
1608 ms
%E8%89%B2%E5%BD%A9%E5%B7%A5%E5%85%B7.png
1709 ms
pantone1.jpg
3008 ms
pantone2.jpg
2078 ms
pantone3.jpg
2687 ms
ral.jpg
2674 ms
ncs.jpg
2323 ms
munsell.jpg
2666 ms
banner1.jpg
2870 ms
v-banner.jpg
3065 ms
GP1601B-fengmian.jpg
2741 ms
FHIP110A-1.jpg
2737 ms
200A.jpg
2753 ms
K7.jpg
2792 ms
cbcc1026.jpg
2798 ms
A-6-001.jpg
2818 ms
%E5%9B%BD%E6%A0%87%E8%89%B2%E5%8D%A1%E4%B8%BB%E5%9B%BE.jpg
2849 ms
ART-%E4%B8%BB%E5%9B%BE2.jpg
2857 ms
banner2.jpg
3522 ms
VCP-S25.jpg
2905 ms
VCP-F25-1.jpg
2914 ms
JPMA-P-02.jpg
2924 ms
DS-52X-1.jpg
2964 ms
CNCS-1640-1.jpg
2991 ms
CNCS-202-2.jpg
2979 ms
50566-01.jpg
3030 ms
YS-IRIS-03-01.jpg
3033 ms
banner3.jpg
4180 ms
iconfont.woff
3074 ms
4458247f-f06d-46b9-9fae-681908b9ebba.jpg
2897 ms
378faa53-f9cc-4084-9d67-c0aee7ba6229.jpg
2468 ms
e876b659-c05c-4014-aa05-3b2fd78ccbd2.jpg
2816 ms
c96f24d7-3de8-4eb2-abe3-99b309727411.jpg
2431 ms
c2127864-e354-4679-96fc-4ba48ee4e785.jpg
2502 ms
1b51656e-fa80-4ff2-b1e3-eca46019385a.jpg
2713 ms
37e43e90-7509-4a0c-986d-c9d944f4339b.jpg
2381 ms
48637298-b0c3-44c5-ad92-2c5075e09e74.jpg
2905 ms
videobg.jpg
2782 ms
partner%20151.png
2953 ms
partner%20152.png
2563 ms
partner%20153.png
2286 ms
partner%20154.png
2341 ms
partner%20155.png
2739 ms
partner%20156.png
2696 ms
partner%20157.png
2525 ms
partner%20158.png
2750 ms
jinghui.png!comp
2271 ms
bottom_lxxh.png
4151 ms
bottom_gongshangwangjian2.jpg
2859 ms
qtccolor.com SEO score
![]()
ZH
![]()
N/A
UTF-8
Language claimed in HTML meta tag should match the language actually used on the web page. Otherwise Qtccolor.com can be misinterpreted by Google and other search engines. Our service has detected that Chinese is used on the page, and neither this language nor any other was claimed in <html> or <meta> tags. Our system also found out that Qtccolor.com main page’s claimed encoding is utf-8. Use of this encoding format is the best practice as the main page visitors from all over the world won’t have any issues with symbol transcription.
qtccolor.com
Open Graph description is not detected on the main page of Qtccolor. Lack of Open Graph description can be counter-productive for their social media presence, as such a description allows converting a website homepage (or other pages) into good-looking, rich and well-structured posts, when it is being shared on Facebook and other social media. For example, adding the following code snippet into HTML <head> tag will help to represent this web page correctly in social networks: