Report Summary

  • 49

    Performance

    Renders faster than
    68% of other websites

  • 89

    Accessibility

    Visual factors better than
    that of 72% of websites

  • 67

    Best Practices

    More advanced features
    available than in
    24% of websites

  • 92

    SEO

    Google-friendlier than
    75% of websites

Page Load Speed

27.3 sec in total

First Response

139 ms

Resources Loaded

19.2 sec

Page Rendered

7.9 sec
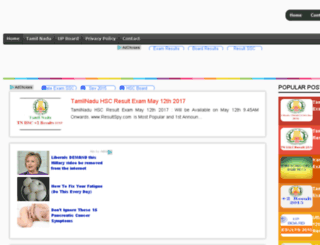
resultspy.com screenshot

About Website

Visit resultspy.com now to see the best up-to-date Resultspy content and also check out these interesting facts you probably never knew about resultspy.com

No.1 Student Service Portal. First Result Announced Site. All Results and Notifications Available Here. Fast Way to View Your Result.

Visit resultspy.com

Key Findings

We analyzed Resultspy.com page load time and found that the first response time was 139 ms and then it took 27.2 sec to load all DOM resources and completely render a web page. This is a poor result, as 95% of websites can load faster.

Performance Metrics

resultspy.com performance score

49

Measured Metrics

name

value

score

weighting

FCP (First Contentful Paint)

Value4.2 s

20/100

10%

LCP (Largest Contentful Paint)

Value4.9 s

28/100

25%

SI (Speed Index)

Value4.2 s

78/100

10%

TBT (Total Blocking Time)

Value720 ms

41/100

30%

CLS (Cumulative Layout Shift)

Value0.078

95/100

15%

TTI (Time to Interactive)

Value6.8 s

55/100

10%

Network Requests Diagram

resultspy.com

139 ms

www.resultspy.com

143 ms

3730162741-widget_css_bundle.css

790 ms

font-awesome.css

752 ms

jquery.min.js

757 ms

Our browser made a total of 46 requests to load all elements on the main page. We found that 7% of them (3 requests) were addressed to the original Resultspy.com, 15% (7 requests) were made to 2.bp.blogspot.com and 15% (7 requests) were made to 3.bp.blogspot.com. The less responsive or slowest element that took the longest time to load (6 sec) relates to the external source 2.bp.blogspot.com.

Page Optimization Overview & Recommendations

Page size can be reduced by 447.2 kB (46%)

Content Size

970.7 kB

After Optimization

523.5 kB

In fact, the total size of Resultspy.com main page is 970.7 kB. This result falls beyond the top 1M of websites and identifies a large and not optimized web page that may take ages to load. 50% of websites need less resources to load. Javascripts take 626.6 kB which makes up the majority of the site volume.

HTML Optimization

-77%

Potential reduce by 78.4 kB

  • Original 101.2 kB
  • After minification 93.6 kB
  • After compression 22.8 kB

HTML content can be minified and compressed by a website’s server. The most efficient way is to compress content using GZIP which reduces data amount travelling through the network between server and browser. HTML code on this page is well minified. It is highly recommended that content of this web page should be compressed using GZIP, as it can save up to 78.4 kB or 77% of the original size.

Image Optimization

-2%

Potential reduce by 3.8 kB

  • Original 212.8 kB
  • After minification 209.0 kB

Image size optimization can help to speed up a website loading time. The chart above shows the difference between the size before and after optimization. Resultspy images are well optimized though.

JavaScript Optimization

-54%

Potential reduce by 338.9 kB

  • Original 626.6 kB
  • After minification 624.9 kB
  • After compression 287.7 kB

It’s better to minify JavaScript in order to improve website performance. The diagram shows the current total size of all JavaScript files against the prospective JavaScript size after its minification and compression. It is highly recommended that all JavaScript files should be compressed and minified as it can save up to 338.9 kB or 54% of the original size.

CSS Optimization

-87%

Potential reduce by 26.1 kB

  • Original 30.1 kB
  • After minification 17.8 kB
  • After compression 4.0 kB

CSS files minification is very important to reduce a web page rendering time. The faster CSS files can load, the earlier a page can be rendered. Resultspy.com needs all CSS files to be minified and compressed as it can save up to 26.1 kB or 87% of the original size.

Requests Breakdown

Number of requests can be reduced by 10 (23%)

Requests Now

44

After Optimization

34

The browser has sent 44 CSS, Javascripts, AJAX and image requests in order to completely render the main page of Resultspy. We recommend that multiple CSS and JavaScript files should be merged into one by each type, as it can help reduce assets requests from 11 to 1 for JavaScripts and as a result speed up the page load time.

Accessibility Review

resultspy.com accessibility score

89

Accessibility Issues

Contrast

These are opportunities to improve the legibility of your content.

Impact

Issue

High

Background and foreground colors do not have a sufficient contrast ratio.

Navigation

These are opportunities to improve keyboard navigation in your application.

Impact

Issue

High

Heading elements are not in a sequentially-descending order

Names and labels

These are opportunities to improve the semantics of the controls in your application. This may enhance the experience for users of assistive technology, like a screen reader.

Impact

Issue

High

Links do not have a discernible name

Best Practices

resultspy.com best practices score

67

Areas of Improvement

Trust and Safety

Impact

Issue

High

Does not use HTTPS

High

Includes front-end JavaScript libraries with known security vulnerabilities

Low

Ensure CSP is effective against XSS attacks

User Experience

Impact

Issue

High

Serves images with low resolution

General

Impact

Issue

Low

Detected JavaScript libraries

High

Browser errors were logged to the console

SEO Factors

resultspy.com SEO score

92

Search Engine Optimization Advices

Mobile Friendly

Make sure your pages are mobile friendly so users don’t have to pinch or zoom in order to read the content pages. [Learn more](https://developers.google.com/search/mobile-sites/).

Impact

Issue

High

Document uses legible font sizes

Language and Encoding

  • Language Detected

    N/A

  • Language Claimed

    N/A

  • Encoding

    UTF-8

Language claimed in HTML meta tag should match the language actually used on the web page. Otherwise Resultspy.com can be misinterpreted by Google and other search engines. Unfortunately we cannot identify language used on the page (probably there is a mix of languages, too little text or something else) and no language is claimed in <html> or <meta> tags either. Our system also found out that Resultspy.com main page’s claimed encoding is utf-8. Use of this encoding format is the best practice as the main page visitors from all over the world won’t have any issues with symbol transcription.

Social Sharing Optimization

Open Graph description is not detected on the main page of Resultspy. Lack of Open Graph description can be counter-productive for their social media presence, as such a description allows converting a website homepage (or other pages) into good-looking, rich and well-structured posts, when it is being shared on Facebook and other social media. For example, adding the following code snippet into HTML <head> tag will help to represent this web page correctly in social networks: