Report Summary

  • 0

    Performance

  • 0

    Accessibility

  • 0

    Best Practices

  • 0

    SEO

sapergalleries.com

Saper Galleries, award-winning, fine arts gallery of international acclaim

Page Load Speed

4.7 sec in total

First Response

533 ms

Resources Loaded

2.3 sec

Page Rendered

1.8 sec
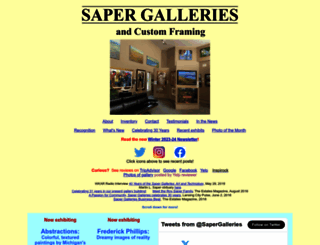
sapergalleries.com screenshot

About Website

Click here to check amazing Saper Galleries content for United States. Otherwise, check out these important facts you probably never knew about sapergalleries.com

Award-winning Saper Galleries provides quality works of art by artists of international acclaim from Peter Max to Rembrandt to Dr. Seuss: paintings, limited edition prints, sculpture, mobiles, hand-bl...

Visit sapergalleries.com

Key Findings

We analyzed Sapergalleries.com page load time and found that the first response time was 533 ms and then it took 4.1 sec to load all DOM resources and completely render a web page. This is a poor result, as 65% of websites can load faster.

Performance Metrics

sapergalleries.com performance score

0

Network Requests Diagram

sapergalleries.com

533 ms

Stacked_TA_logo.png

54 ms

Hyperrealism.jpg

256 ms

Callihaneastgallerysouthview.JPG

254 ms

Callihanfrontentrancewall.JPG

250 ms

Our browser made a total of 131 requests to load all elements on the main page. We found that 70% of them (92 requests) were addressed to the original Sapergalleries.com, 11% (14 requests) were made to Pbs.twimg.com and 5% (7 requests) were made to Platform.twitter.com. The less responsive or slowest element that took the longest time to load (761 ms) belongs to the original domain Sapergalleries.com.

Page Optimization Overview & Recommendations

Page size can be reduced by 821.6 kB (8%)

Content Size

10.9 MB

After Optimization

10.1 MB

In fact, the total size of Sapergalleries.com main page is 10.9 MB. This result falls beyond the top 1M of websites and identifies a large and not optimized web page that may take ages to load. 85% of websites need less resources to load and that’s why Accessify’s recommendations for optimization and resource minification can be helpful for this project. Images take 10.1 MB which makes up the majority of the site volume.

HTML Optimization

-95%

Potential reduce by 661.3 kB

  • Original 694.9 kB
  • After minification 336.9 kB
  • After compression 33.6 kB

HTML content can be minified and compressed by a website’s server. The most efficient way is to compress content using GZIP which reduces data amount travelling through the network between server and browser. This page needs HTML code to be minified as it can gain 358.0 kB, which is 52% of the original size. It is highly recommended that content of this web page should be compressed using GZIP, as it can save up to 661.3 kB or 95% of the original size.

Image Optimization

-1%

Potential reduce by 86.3 kB

  • Original 10.1 MB
  • After minification 10.0 MB

Image size optimization can help to speed up a website loading time. The chart above shows the difference between the size before and after optimization. Saper Galleries images are well optimized though.

JavaScript Optimization

-60%

Potential reduce by 33.0 kB

  • Original 54.6 kB
  • After minification 54.6 kB
  • After compression 21.6 kB

It’s better to minify JavaScript in order to improve website performance. The diagram shows the current total size of all JavaScript files against the prospective JavaScript size after its minification and compression. It is highly recommended that all JavaScript files should be compressed and minified as it can save up to 33.0 kB or 60% of the original size.

CSS Optimization

-84%

Potential reduce by 41.0 kB

  • Original 48.6 kB
  • After minification 48.5 kB
  • After compression 7.6 kB

CSS files minification is very important to reduce a web page rendering time. The faster CSS files can load, the earlier a page can be rendered. Sapergalleries.com needs all CSS files to be minified and compressed as it can save up to 41.0 kB or 84% of the original size.

Requests Breakdown

Number of requests can be reduced by 16 (13%)

Requests Now

128

After Optimization

112

The browser has sent 128 CSS, Javascripts, AJAX and image requests in order to completely render the main page of Saper Galleries. We recommend that multiple CSS and JavaScript files should be merged into one by each type, as it can help reduce assets requests from 8 to 1 for JavaScripts and from 5 to 1 for CSS and as a result speed up the page load time.

SEO Factors

sapergalleries.com SEO score

0

Language and Encoding

  • Language Detected

    EN

  • Language Claimed

    N/A

  • Encoding

    WINDOWS-1252

Language claimed in HTML meta tag should match the language actually used on the web page. Otherwise Sapergalleries.com can be misinterpreted by Google and other search engines. Our service has detected that English is used on the page, and neither this language nor any other was claimed in <html> or <meta> tags. Our system also found out that Sapergalleries.com main page’s claimed encoding is windows-1252. Changing it to UTF-8 can be a good choice, as this format is commonly used for encoding all over the web and thus their visitors won’t have any troubles with symbol transcription or reading.

Social Sharing Optimization

Open Graph description is not detected on the main page of Saper Galleries. Lack of Open Graph description can be counter-productive for their social media presence, as such a description allows converting a website homepage (or other pages) into good-looking, rich and well-structured posts, when it is being shared on Facebook and other social media. For example, adding the following code snippet into HTML <head> tag will help to represent this web page correctly in social networks: