Report Summary

  • 9

    Performance

    Renders faster than
    23% of other websites

  • 73

    Accessibility

    Visual factors better than
    that of 38% of websites

  • 67

    Best Practices

    More advanced features
    available than in
    24% of websites

  • 84

    SEO

    Google-friendlier than
    52% of websites

schafer.com.tr

Schafer

Page Load Speed

4.2 sec in total

First Response

115 ms

Resources Loaded

3.6 sec

Page Rendered

536 ms
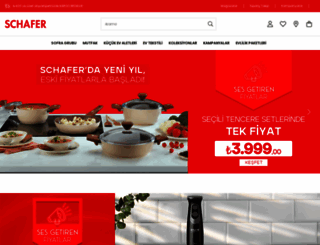
schafer.com.tr screenshot

About Website

Click here to check amazing Schafer content for Turkey. Otherwise, check out these important facts you probably never knew about schafer.com.tr

Schafer: Yemek Takımı, Çatal Bıçak takımı, Kahvaltı Takımları, Tencereler, Tavalar ve daha fazlası.

Visit schafer.com.tr

Key Findings

We analyzed Schafer.com.tr page load time and found that the first response time was 115 ms and then it took 4.1 sec to load all DOM resources and completely render a web page. This is a poor result, as 65% of websites can load faster.

Performance Metrics

schafer.com.tr performance score

9

Measured Metrics

name

value

score

weighting

FCP (First Contentful Paint)

Value6.0 s

4/100

10%

LCP (Largest Contentful Paint)

Value20.5 s

0/100

25%

SI (Speed Index)

Value12.3 s

3/100

10%

TBT (Total Blocking Time)

Value4,160 ms

1/100

30%

CLS (Cumulative Layout Shift)

Value0.239

52/100

15%

TTI (Time to Interactive)

Value25.7 s

0/100

10%

Network Requests Diagram

schafer.com.tr

115 ms

www.schafer.com.tr

501 ms

opensans.css

27 ms

standart.css

90 ms

default.css

30 ms

Our browser made a total of 140 requests to load all elements on the main page. We found that 69% of them (96 requests) were addressed to the original Schafer.com.tr, 6% (9 requests) were made to Cdnjs.cloudflare.com and 4% (5 requests) were made to Fonts.gstatic.com. The less responsive or slowest element that took the longest time to load (1.9 sec) relates to the external source Yastatic.net.

Page Optimization Overview & Recommendations

Page size can be reduced by 187.2 kB (3%)

Content Size

5.5 MB

After Optimization

5.4 MB

In fact, the total size of Schafer.com.tr main page is 5.5 MB. This result falls beyond the top 1M of websites and identifies a large and not optimized web page that may take ages to load. 80% of websites need less resources to load and that’s why Accessify’s recommendations for optimization and resource minification can be helpful for this project. Images take 4.9 MB which makes up the majority of the site volume.

HTML Optimization

-81%

Potential reduce by 119.5 kB

  • Original 147.7 kB
  • After minification 147.7 kB
  • After compression 28.3 kB

HTML content can be minified and compressed by a website’s server. The most efficient way is to compress content using GZIP which reduces data amount travelling through the network between server and browser. HTML code on this page is well minified. It is highly recommended that content of this web page should be compressed using GZIP, as it can save up to 119.5 kB or 81% of the original size.

Image Optimization

-0%

Potential reduce by 13.8 kB

  • Original 4.9 MB
  • After minification 4.9 MB

Image size optimization can help to speed up a website loading time. The chart above shows the difference between the size before and after optimization. Schafer images are well optimized though.

JavaScript Optimization

-12%

Potential reduce by 53.7 kB

  • Original 443.3 kB
  • After minification 443.3 kB
  • After compression 389.6 kB

It’s better to minify JavaScript in order to improve website performance. The diagram shows the current total size of all JavaScript files against the prospective JavaScript size after its minification and compression. It is highly recommended that all JavaScript files should be compressed and minified as it can save up to 53.7 kB or 12% of the original size.

CSS Optimization

-1%

Potential reduce by 194 B

  • Original 36.5 kB
  • After minification 36.5 kB
  • After compression 36.3 kB

CSS files minification is very important to reduce a web page rendering time. The faster CSS files can load, the earlier a page can be rendered. Schafer.com.tr has all CSS files already compressed.

Requests Breakdown

Number of requests can be reduced by 62 (50%)

Requests Now

123

After Optimization

61

The browser has sent 123 CSS, Javascripts, AJAX and image requests in order to completely render the main page of Schafer. We recommend that multiple CSS and JavaScript files should be merged into one by each type, as it can help reduce assets requests from 39 to 1 for JavaScripts and from 18 to 1 for CSS and as a result speed up the page load time.

Accessibility Review

schafer.com.tr accessibility score

73

Accessibility Issues

Names and labels

These are opportunities to improve the semantics of the controls in your application. This may enhance the experience for users of assistive technology, like a screen reader.

Impact

Issue

High

Buttons do not have an accessible name

High

Image elements do not have [alt] attributes

High

Links do not have a discernible name

Contrast

These are opportunities to improve the legibility of your content.

Impact

Issue

High

Background and foreground colors do not have a sufficient contrast ratio.

Tables and lists

These are opportunities to improve the experience of reading tabular or list data using assistive technology, like a screen reader.

Impact

Issue

High

Lists do not contain only <li> elements and script supporting elements (<script> and <template>).

High

List items (<li>) are not contained within <ul> or <ol> parent elements.

Best practices

These items highlight common accessibility best practices.

Impact

Issue

High

[user-scalable="no"] is used in the <meta name="viewport"> element or the [maximum-scale] attribute is less than 5.

Best Practices

schafer.com.tr best practices score

67

Areas of Improvement

Trust and Safety

Impact

Issue

High

Does not use HTTPS

High

Includes front-end JavaScript libraries with known security vulnerabilities

Low

Ensure CSP is effective against XSS attacks

User Experience

Impact

Issue

High

Serves images with low resolution

General

Impact

Issue

Low

Detected JavaScript libraries

High

Browser errors were logged to the console

High

Page has valid source maps

SEO Factors

schafer.com.tr SEO score

84

Search Engine Optimization Advices

Crawling and Indexing

To appear in search results, crawlers need access to your app.

Impact

Issue

High

Links are not crawlable

Content Best Practices

Format your HTML in a way that enables crawlers to better understand your app’s content.

Impact

Issue

High

Image elements do not have [alt] attributes

Mobile Friendly

Make sure your pages are mobile friendly so users don’t have to pinch or zoom in order to read the content pages. [Learn more](https://developers.google.com/search/mobile-sites/).

Impact

Issue

High

Document uses legible font sizes

High

Tap targets are not sized appropriately

Language and Encoding

  • Language Detected

    TR

  • Language Claimed

    TR

  • Encoding

    UTF-8

Language claimed in HTML meta tag should match the language actually used on the web page. Otherwise Schafer.com.tr can be misinterpreted by Google and other search engines. Our service has detected that Turkish is used on the page, and it matches the claimed language. Our system also found out that Schafer.com.tr main page’s claimed encoding is utf-8. Use of this encoding format is the best practice as the main page visitors from all over the world won’t have any issues with symbol transcription.

Social Sharing Optimization

Open Graph data is detected on the main page of Schafer. This is the best way to make the web page social media friendly. Here is how it looks like on Facebook: