Report Summary

  • 16

    Performance

    Renders faster than
    30% of other websites

  • 73

    Accessibility

    Visual factors better than
    that of 39% of websites

  • 83

    Best Practices

    More advanced features
    available than in
    56% of websites

  • 92

    SEO

    Google-friendlier than
    75% of websites

selfstudyhistory.com

SELF STUDY HISTORY – India's number one portal for History Optional

Page Load Speed

1.5 sec in total

First Response

268 ms

Resources Loaded

883 ms

Page Rendered

353 ms

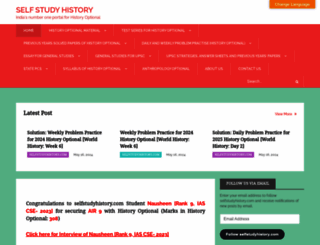
selfstudyhistory.com screenshot

About Website

Visit selfstudyhistory.com now to see the best up-to-date SELF STUDY HISTORY content for India and also check out these interesting facts you probably never knew about selfstudyhistory.com

Congratulations to selfstudyhistory.com Student Nausheen [Rank 9, IAS CSE- 2023] for securing AIR 9 with History Optional (Marks in History Optional: 308) Click here for Answer Sheet of Nausheen [Rank...

Visit selfstudyhistory.com

Key Findings

We analyzed Selfstudyhistory.com page load time and found that the first response time was 268 ms and then it took 1.2 sec to load all DOM resources and completely render a web page. This is quite a good result, as only 25% of websites can load faster.

Performance Metrics

selfstudyhistory.com performance score

16

Measured Metrics

name

value

score

weighting

FCP (First Contentful Paint)

Value5.7 s

5/100

10%

LCP (Largest Contentful Paint)

Value8.8 s

1/100

25%

SI (Speed Index)

Value50.9 s

0/100

10%

TBT (Total Blocking Time)

Value56,050 ms

0/100

30%

CLS (Cumulative Layout Shift)

Value0.001

100/100

15%

TTI (Time to Interactive)

Value80.8 s

0/100

10%

Network Requests Diagram

selfstudyhistory.com

268 ms

webfont.js

13 ms

85 ms

css

116 ms

102 ms

Our browser made a total of 43 requests to load all elements on the main page. We found that 2% of them (1 request) were addressed to the original Selfstudyhistory.com, 16% (7 requests) were made to S1.wp.com and 16% (7 requests) were made to S2.wp.com. The less responsive or slowest element that took the longest time to load (268 ms) belongs to the original domain Selfstudyhistory.com.

Page Optimization Overview & Recommendations

Page size can be reduced by 489.8 kB (56%)

Content Size

878.7 kB

After Optimization

388.8 kB

In fact, the total size of Selfstudyhistory.com main page is 878.7 kB. This result falls beyond the top 1M of websites and identifies a large and not optimized web page that may take ages to load. 65% of websites need less resources to load. Javascripts take 569.5 kB which makes up the majority of the site volume.

HTML Optimization

-75%

Potential reduce by 51.5 kB

  • Original 68.3 kB
  • After minification 65.4 kB
  • After compression 16.8 kB

HTML content can be minified and compressed by a website’s server. The most efficient way is to compress content using GZIP which reduces data amount travelling through the network between server and browser. HTML code on this page is well minified. It is highly recommended that content of this web page should be compressed using GZIP, as it can save up to 51.5 kB or 75% of the original size.

Image Optimization

-1%

Potential reduce by 1.9 kB

  • Original 222.6 kB
  • After minification 220.7 kB

Image size optimization can help to speed up a website loading time. The chart above shows the difference between the size before and after optimization. SELF STUDY HISTORY images are well optimized though.

JavaScript Optimization

-74%

Potential reduce by 423.9 kB

  • Original 569.5 kB
  • After minification 441.0 kB
  • After compression 145.6 kB

It’s better to minify JavaScript in order to improve website performance. The diagram shows the current total size of all JavaScript files against the prospective JavaScript size after its minification and compression. It is highly recommended that all JavaScript files should be compressed and minified as it can save up to 423.9 kB or 74% of the original size.

CSS Optimization

-69%

Potential reduce by 12.5 kB

  • Original 18.2 kB
  • After minification 16.3 kB
  • After compression 5.7 kB

CSS files minification is very important to reduce a web page rendering time. The faster CSS files can load, the earlier a page can be rendered. Selfstudyhistory.com needs all CSS files to be minified and compressed as it can save up to 12.5 kB or 69% of the original size.

Requests Breakdown

Number of requests can be reduced by 19 (63%)

Requests Now

30

After Optimization

11

The browser has sent 30 CSS, Javascripts, AJAX and image requests in order to completely render the main page of SELF STUDY HISTORY. We recommend that multiple CSS and JavaScript files should be merged into one by each type, as it can help reduce assets requests from 12 to 1 for JavaScripts and from 9 to 1 for CSS and as a result speed up the page load time.

Accessibility Review

selfstudyhistory.com accessibility score

73

Accessibility Issues

Names and labels

These are opportunities to improve the semantics of the controls in your application. This may enhance the experience for users of assistive technology, like a screen reader.

Impact

Issue

High

Buttons do not have an accessible name

Low

No form fields have multiple labels

High

Links do not have a discernible name

Contrast

These are opportunities to improve the legibility of your content.

Impact

Issue

High

Background and foreground colors do not have a sufficient contrast ratio.

ARIA

These are opportunities to improve the usage of ARIA in your application which may enhance the experience for users of assistive technology, like a screen reader.

Impact

Issue

High

ARIA IDs are not unique

Navigation

These are opportunities to improve keyboard navigation in your application.

Impact

Issue

High

Heading elements are not in a sequentially-descending order

Tables and lists

These are opportunities to improve the experience of reading tabular or list data using assistive technology, like a screen reader.

Impact

Issue

High

Lists do not contain only <li> elements and script supporting elements (<script> and <template>).

Best practices

These items highlight common accessibility best practices.

Impact

Issue

High

[user-scalable="no"] is used in the <meta name="viewport"> element or the [maximum-scale] attribute is less than 5.

Best Practices

selfstudyhistory.com best practices score

83

Areas of Improvement

Trust and Safety

Impact

Issue

High

Does not use HTTPS

Low

Ensure CSP is effective against XSS attacks

General

Impact

Issue

Low

Detected JavaScript libraries

High

Browser errors were logged to the console

SEO Factors

selfstudyhistory.com SEO score

92

Search Engine Optimization Advices

Crawling and Indexing

To appear in search results, crawlers need access to your app.

Impact

Issue

High

Links are not crawlable

Mobile Friendly

Make sure your pages are mobile friendly so users don’t have to pinch or zoom in order to read the content pages. [Learn more](https://developers.google.com/search/mobile-sites/).

Impact

Issue

High

Document uses legible font sizes

High

Tap targets are not sized appropriately

Language and Encoding

  • Language Detected

    EN

  • Language Claimed

    EN

  • Encoding

    UTF-8

Language claimed in HTML meta tag should match the language actually used on the web page. Otherwise Selfstudyhistory.com can be misinterpreted by Google and other search engines. Our service has detected that English is used on the page, and it matches the claimed language. Our system also found out that Selfstudyhistory.com main page’s claimed encoding is utf-8. Use of this encoding format is the best practice as the main page visitors from all over the world won’t have any issues with symbol transcription.

Social Sharing Optimization

Open Graph data is detected on the main page of SELF STUDY HISTORY. This is the best way to make the web page social media friendly. Here is how it looks like on Facebook: