Report Summary

  • 23

    Performance

    Renders faster than
    42% of other websites

  • 65

    Accessibility

    Visual factors better than
    that of 31% of websites

  • 83

    Best Practices

    More advanced features
    available than in
    56% of websites

  • 84

    SEO

    Google-friendlier than
    53% of websites

tabippo.net

TABIPPO.NET|旅の総合WEBメディア

Page Load Speed

18.6 sec in total

First Response

3.3 sec

Resources Loaded

14 sec

Page Rendered

1.3 sec

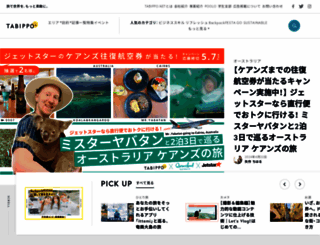
tabippo.net screenshot

About Website

Click here to check amazing TABIPPO content for Japan. Otherwise, check out these important facts you probably never knew about tabippo.net

TABIPPO.NETは旅をテーマにした総合WEBメディアです。これからの時代の、多様な旅を若者に提案します。「旅で世界を、もっと素敵に」をビジョンに掲げる株式会社TABIPPOが運営しています。

Visit tabippo.net

Key Findings

We analyzed Tabippo.net page load time and found that the first response time was 3.3 sec and then it took 15.2 sec to load all DOM resources and completely render a web page. This is a poor result, as 90% of websites can load faster.

Performance Metrics

tabippo.net performance score

23

Measured Metrics

name

value

score

weighting

FCP (First Contentful Paint)

Value4.4 s

16/100

10%

LCP (Largest Contentful Paint)

Value33.4 s

0/100

25%

SI (Speed Index)

Value9.1 s

14/100

10%

TBT (Total Blocking Time)

Value1,400 ms

16/100

30%

CLS (Cumulative Layout Shift)

Value0.038

100/100

15%

TTI (Time to Interactive)

Value68.6 s

0/100

10%

Network Requests Diagram

tabippo.net

3349 ms

style.css

689 ms

font-awesome.min.css

30 ms

slick.css

354 ms

drawer.css

355 ms

Our browser made a total of 145 requests to load all elements on the main page. We found that 77% of them (111 requests) were addressed to the original Tabippo.net, 5% (7 requests) were made to Apis.google.com and 2% (3 requests) were made to Cdn-ak.b.st-hatena.com. The less responsive or slowest element that took the longest time to load (5.9 sec) belongs to the original domain Tabippo.net.

Page Optimization Overview & Recommendations

Page size can be reduced by 778.3 kB (14%)

Content Size

5.5 MB

After Optimization

4.7 MB

In fact, the total size of Tabippo.net main page is 5.5 MB. This result falls beyond the top 1M of websites and identifies a large and not optimized web page that may take ages to load. 65% of websites need less resources to load. Images take 4.9 MB which makes up the majority of the site volume.

HTML Optimization

-82%

Potential reduce by 88.1 kB

  • Original 107.1 kB
  • After minification 96.8 kB
  • After compression 19.0 kB

HTML content can be minified and compressed by a website’s server. The most efficient way is to compress content using GZIP which reduces data amount travelling through the network between server and browser. HTML code on this page is well minified. It is highly recommended that content of this web page should be compressed using GZIP, as it can save up to 88.1 kB or 82% of the original size.

Image Optimization

-7%

Potential reduce by 348.9 kB

  • Original 4.9 MB
  • After minification 4.6 MB

Image size optimization can help to speed up a website loading time. The chart above shows the difference between the size before and after optimization. TABIPPO images are well optimized though.

JavaScript Optimization

-61%

Potential reduce by 200.3 kB

  • Original 327.8 kB
  • After minification 314.5 kB
  • After compression 127.5 kB

It’s better to minify JavaScript in order to improve website performance. The diagram shows the current total size of all JavaScript files against the prospective JavaScript size after its minification and compression. It is highly recommended that all JavaScript files should be compressed and minified as it can save up to 200.3 kB or 61% of the original size.

CSS Optimization

-87%

Potential reduce by 141.1 kB

  • Original 162.7 kB
  • After minification 114.8 kB
  • After compression 21.7 kB

CSS files minification is very important to reduce a web page rendering time. The faster CSS files can load, the earlier a page can be rendered. Tabippo.net needs all CSS files to be minified and compressed as it can save up to 141.1 kB or 87% of the original size.

Requests Breakdown

Number of requests can be reduced by 37 (26%)

Requests Now

140

After Optimization

103

The browser has sent 140 CSS, Javascripts, AJAX and image requests in order to completely render the main page of TABIPPO. We recommend that multiple CSS and JavaScript files should be merged into one by each type, as it can help reduce assets requests from 24 to 1 for JavaScripts and from 9 to 1 for CSS and as a result speed up the page load time.

Accessibility Review

tabippo.net accessibility score

65

Accessibility Issues

Contrast

These are opportunities to improve the legibility of your content.

Impact

Issue

High

Background and foreground colors do not have a sufficient contrast ratio.

Internationalization and localization

These are opportunities to improve the interpretation of your content by users in different locales.

Impact

Issue

High

<html> element does not have a [lang] attribute

Names and labels

These are opportunities to improve the semantics of the controls in your application. This may enhance the experience for users of assistive technology, like a screen reader.

Impact

Issue

High

Image elements do not have [alt] attributes

High

Links do not have a discernible name

Best practices

These items highlight common accessibility best practices.

Impact

Issue

High

[user-scalable="no"] is used in the <meta name="viewport"> element or the [maximum-scale] attribute is less than 5.

Best Practices

tabippo.net best practices score

83

Areas of Improvement

Trust and Safety

Impact

Issue

High

Does not use HTTPS

High

Includes front-end JavaScript libraries with known security vulnerabilities

Low

Ensure CSP is effective against XSS attacks

General

Impact

Issue

Low

Detected JavaScript libraries

High

Page has valid source maps

SEO Factors

tabippo.net SEO score

84

Search Engine Optimization Advices

Crawling and Indexing

To appear in search results, crawlers need access to your app.

Impact

Issue

High

Links are not crawlable

Content Best Practices

Format your HTML in a way that enables crawlers to better understand your app’s content.

Impact

Issue

High

Image elements do not have [alt] attributes

Mobile Friendly

Make sure your pages are mobile friendly so users don’t have to pinch or zoom in order to read the content pages. [Learn more](https://developers.google.com/search/mobile-sites/).

Impact

Issue

High

Document uses legible font sizes

High

Tap targets are not sized appropriately

Language and Encoding

  • Language Detected

    JA

  • Language Claimed

    N/A

  • Encoding

    UTF-8

Language claimed in HTML meta tag should match the language actually used on the web page. Otherwise Tabippo.net can be misinterpreted by Google and other search engines. Our service has detected that Japanese is used on the page, and neither this language nor any other was claimed in <html> or <meta> tags. Our system also found out that Tabippo.net main page’s claimed encoding is utf-8. Use of this encoding format is the best practice as the main page visitors from all over the world won’t have any issues with symbol transcription.

Social Sharing Optimization

Open Graph data is detected on the main page of TABIPPO. This is the best way to make the web page social media friendly. Here is how it looks like on Facebook: