3 sec in total
575 ms
2.2 sec
173 ms
Welcome to tabletag.net homepage info - get ready to check Table Tag best content for Japan right away, or after learning these important things about tabletag.net
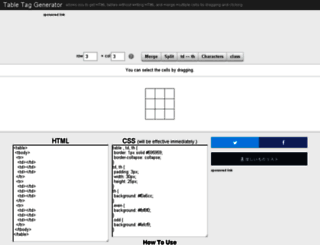
Table Tag Generator is a GUI tool to create the HTML table.This allows you to get a table tag without writing HTML, merge the cells, and enter the characters directly in the table.You don't need to wo...
Visit tabletag.netWe analyzed Tabletag.net page load time and found that the first response time was 575 ms and then it took 2.4 sec to load all DOM resources and completely render a web page. This is quite a good result, as only 45% of websites can load faster.
tabletag.net performance score
name
value
score
weighting
Value2.8 s
57/100
10%
Value5.0 s
26/100
25%
Value6.5 s
39/100
10%
Value13,580 ms
0/100
30%
Value0.183
66/100
15%
Value21.6 s
1/100
10%
575 ms
1178 ms
26 ms
60 ms
22 ms
Our browser made a total of 35 requests to load all elements on the main page. We found that 9% of them (3 requests) were addressed to the original Tabletag.net, 17% (6 requests) were made to Pagead2.googlesyndication.com and 17% (6 requests) were made to Tpc.googlesyndication.com. The less responsive or slowest element that took the longest time to load (1.2 sec) belongs to the original domain Tabletag.net.
Page size can be reduced by 190.2 kB (49%)
391.3 kB
201.2 kB
In fact, the total size of Tabletag.net main page is 391.3 kB. This result falls beyond the top 1M of websites and identifies a large and not optimized web page that may take ages to load. 30% of websites need less resources to load. HTML takes 222.2 kB which makes up the majority of the site volume.
Potential reduce by 158.1 kB
HTML content can be minified and compressed by a website’s server. The most efficient way is to compress content using GZIP which reduces data amount travelling through the network between server and browser. HTML code on this page is well minified. It is highly recommended that content of this web page should be compressed using GZIP, as it can save up to 158.1 kB or 71% of the original size.
Potential reduce by 12.1 kB
Image size optimization can help to speed up a website loading time. The chart above shows the difference between the size before and after optimization. Obviously, Table Tag needs image optimization as it can save up to 12.1 kB or 11% of the original volume. The most popular and efficient tools for JPEG and PNG image optimization are Jpegoptim and PNG Crush.
Potential reduce by 20.0 kB
It’s better to minify JavaScript in order to improve website performance. The diagram shows the current total size of all JavaScript files against the prospective JavaScript size after its minification and compression. It is highly recommended that all JavaScript files should be compressed and minified as it can save up to 20.0 kB or 37% of the original size.
Number of requests can be reduced by 17 (55%)
31
14
The browser has sent 31 CSS, Javascripts, AJAX and image requests in order to completely render the main page of Table Tag. We recommend that multiple CSS and JavaScript files should be merged into one by each type, as it can help reduce assets requests from 13 to 1 for JavaScripts and as a result speed up the page load time.
tabletag.net
575 ms
tabletag.net
1178 ms
analytics.js
26 ms
adsbygoogle.js
60 ms
collect
22 ms
fontawesome-webfont.woff
729 ms
ca-pub-2538045069303380.js
21 ms
zrt_lookup.html
27 ms
show_ads_impl.js
63 ms
collect
54 ms
ads
238 ms
osd.js
16 ms
ads
329 ms
ads
295 ms
1163797134903487026
25 ms
abg.js
33 ms
m_js_controller.js
45 ms
googlelogo_color_112x36dp.png
43 ms
s
32 ms
x_button_blue2.png
32 ms
s_0ROEw3z8GL_180908036.html
36 ms
kitchen_10PercentOff_RoomandExterior.jpg
78 ms
sbhK2lTE.js
17 ms
Tqng9ngJVK4Gqvh3e602hP-HqlN49KFEUSDtmrOPmWo.js
6 ms
cl
99 ms
creative_add_on.js
190 ms
cTrvNaRi.html
52 ms
1296_wbr_display_ad_300_250_B_11_15-1.jpg
45 ms
lidar.js
35 ms
surly.js
25 ms
ba.html
3 ms
4.gif
8 ms
2532.js
3 ms
box_19_top-right.png
6 ms
ci.png
21 ms
tabletag.net accessibility score
ARIA
These are opportunities to improve the usage of ARIA in your application which may enhance the experience for users of assistive technology, like a screen reader.
Impact
Issue
[aria-*] attributes do not match their roles
Contrast
These are opportunities to improve the legibility of your content.
Impact
Issue
Background and foreground colors do not have a sufficient contrast ratio.
Names and labels
These are opportunities to improve the semantics of the controls in your application. This may enhance the experience for users of assistive technology, like a screen reader.
Impact
Issue
<frame> or <iframe> elements do not have a title
Form elements do not have associated labels
Links do not have a discernible name
tabletag.net best practices score
Trust and Safety
Impact
Issue
Does not use HTTPS
Includes front-end JavaScript libraries with known security vulnerabilities
Ensure CSP is effective against XSS attacks
General
Impact
Issue
Detected JavaScript libraries
Page has valid source maps
tabletag.net SEO score
Mobile Friendly
Make sure your pages are mobile friendly so users don’t have to pinch or zoom in order to read the content pages. [Learn more](https://developers.google.com/search/mobile-sites/).
Impact
Issue
Document uses legible font sizes
Tap targets are not sized appropriately
EN
EN
UTF-8
Language claimed in HTML meta tag should match the language actually used on the web page. Otherwise Tabletag.net can be misinterpreted by Google and other search engines. Our service has detected that English is used on the page, and it matches the claimed language. Our system also found out that Tabletag.net main page’s claimed encoding is utf-8. Use of this encoding format is the best practice as the main page visitors from all over the world won’t have any issues with symbol transcription.
tabletag.net
Open Graph data is detected on the main page of Table Tag. This is the best way to make the web page social media friendly. Here is how it looks like on Facebook: