Report Summary

  • 33

    Performance

    Renders faster than
    53% of other websites

  • 97

    Accessibility

    Visual factors better than
    that of 92% of websites

  • 75

    Best Practices

    More advanced features
    available than in
    36% of websites

  • 98

    SEO

    Google-friendlier than
    92% of websites

tabscap.com

TABSCAP: A Digital Marketing Agency

Page Load Speed

2.8 sec in total

First Response

529 ms

Resources Loaded

2.1 sec

Page Rendered

235 ms
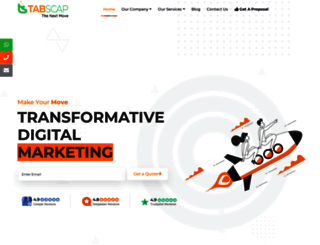
tabscap.com screenshot

About Website

Click here to check amazing TABSCAP content for India. Otherwise, check out these important facts you probably never knew about tabscap.com

At Tabscap, you will find great digital marketing solutions. We are a team of talented young people is committed to make your business boom on the internet.

Visit tabscap.com

Key Findings

We analyzed Tabscap.com page load time and found that the first response time was 529 ms and then it took 2.3 sec to load all DOM resources and completely render a web page. This is quite a good result, as only 45% of websites can load faster.

Performance Metrics

tabscap.com performance score

33

Measured Metrics

name

value

score

weighting

FCP (First Contentful Paint)

Value4.5 s

15/100

10%

LCP (Largest Contentful Paint)

Value10.1 s

0/100

25%

SI (Speed Index)

Value7.8 s

23/100

10%

TBT (Total Blocking Time)

Value780 ms

38/100

30%

CLS (Cumulative Layout Shift)

Value0.004

100/100

15%

TTI (Time to Interactive)

Value10.3 s

25/100

10%

Network Requests Diagram

tabscap.com

529 ms

stylesheet.css

90 ms

css.css

170 ms

slider.css

167 ms

facebook.js

345 ms

Our browser made a total of 87 requests to load all elements on the main page. We found that 78% of them (68 requests) were addressed to the original Tabscap.com, 11% (10 requests) were made to Static.xx.fbcdn.net and 7% (6 requests) were made to Scontent.xx.fbcdn.net. The less responsive or slowest element that took the longest time to load (724 ms) belongs to the original domain Tabscap.com.

Page Optimization Overview & Recommendations

Page size can be reduced by 428.7 kB (33%)

Content Size

1.3 MB

After Optimization

879.8 kB

In fact, the total size of Tabscap.com main page is 1.3 MB. This result falls beyond the top 1M of websites and identifies a large and not optimized web page that may take ages to load. 45% of websites need less resources to load. Images take 965.4 kB which makes up the majority of the site volume.

HTML Optimization

-86%

Potential reduce by 68.3 kB

  • Original 79.2 kB
  • After minification 54.4 kB
  • After compression 10.9 kB

HTML content can be minified and compressed by a website’s server. The most efficient way is to compress content using GZIP which reduces data amount travelling through the network between server and browser. This page needs HTML code to be minified as it can gain 24.8 kB, which is 31% of the original size. It is highly recommended that content of this web page should be compressed using GZIP, as it can save up to 68.3 kB or 86% of the original size.

Image Optimization

-18%

Potential reduce by 170.2 kB

  • Original 965.4 kB
  • After minification 795.2 kB

Image size optimization can help to speed up a website loading time. The chart above shows the difference between the size before and after optimization. Obviously, TABSCAP needs image optimization as it can save up to 170.2 kB or 18% of the original volume. The most popular and efficient tools for JPEG and PNG image optimization are Jpegoptim and PNG Crush.

JavaScript Optimization

-60%

Potential reduce by 87.0 kB

  • Original 144.3 kB
  • After minification 141.8 kB
  • After compression 57.4 kB

It’s better to minify JavaScript in order to improve website performance. The diagram shows the current total size of all JavaScript files against the prospective JavaScript size after its minification and compression. It is highly recommended that all JavaScript files should be compressed and minified as it can save up to 87.0 kB or 60% of the original size.

CSS Optimization

-86%

Potential reduce by 103.2 kB

  • Original 119.5 kB
  • After minification 111.1 kB
  • After compression 16.4 kB

CSS files minification is very important to reduce a web page rendering time. The faster CSS files can load, the earlier a page can be rendered. Tabscap.com needs all CSS files to be minified and compressed as it can save up to 103.2 kB or 86% of the original size.

Requests Breakdown

Number of requests can be reduced by 32 (39%)

Requests Now

83

After Optimization

51

The browser has sent 83 CSS, Javascripts, AJAX and image requests in order to completely render the main page of TABSCAP. We recommend that multiple CSS and JavaScript files should be merged into one by each type, as it can help reduce assets requests from 14 to 1 for JavaScripts and from 7 to 1 for CSS and as a result speed up the page load time.

Accessibility Review

tabscap.com accessibility score

97

Accessibility Issues

Contrast

These are opportunities to improve the legibility of your content.

Impact

Issue

High

Background and foreground colors do not have a sufficient contrast ratio.

Navigation

These are opportunities to improve keyboard navigation in your application.

Impact

Issue

High

Heading elements are not in a sequentially-descending order

Best Practices

tabscap.com best practices score

75

Areas of Improvement

Trust and Safety

Impact

Issue

High

Does not use HTTPS

Low

Ensure CSP is effective against XSS attacks

User Experience

Impact

Issue

High

Displays images with incorrect aspect ratio

General

Impact

Issue

Low

Detected JavaScript libraries

High

Browser errors were logged to the console

High

Page has valid source maps

SEO Factors

tabscap.com SEO score

98

Search Engine Optimization Advices

Mobile Friendly

Make sure your pages are mobile friendly so users don’t have to pinch or zoom in order to read the content pages. [Learn more](https://developers.google.com/search/mobile-sites/).

Impact

Issue

High

Document uses legible font sizes

High

Tap targets are not sized appropriately

Language and Encoding

  • Language Detected

    EN

  • Language Claimed

    N/A

  • Encoding

    UTF-8

Language claimed in HTML meta tag should match the language actually used on the web page. Otherwise Tabscap.com can be misinterpreted by Google and other search engines. Our service has detected that English is used on the page, and neither this language nor any other was claimed in <html> or <meta> tags. Our system also found out that Tabscap.com main page’s claimed encoding is utf-8. Use of this encoding format is the best practice as the main page visitors from all over the world won’t have any issues with symbol transcription.

Social Sharing Optimization

Open Graph description is not detected on the main page of TABSCAP. Lack of Open Graph description can be counter-productive for their social media presence, as such a description allows converting a website homepage (or other pages) into good-looking, rich and well-structured posts, when it is being shared on Facebook and other social media. For example, adding the following code snippet into HTML <head> tag will help to represent this web page correctly in social networks: