Report Summary

  • 48

    Performance

    Renders faster than
    67% of other websites

  • 93

    Accessibility

    Visual factors better than
    that of 82% of websites

  • 92

    Best Practices

    More advanced features
    available than in
    81% of websites

  • 92

    SEO

    Google-friendlier than
    75% of websites

team.blue

Europe’s Leading Supplier of Digital Solutions | team.blue

Page Load Speed

4.2 sec in total

First Response

634 ms

Resources Loaded

2.6 sec

Page Rendered

965 ms
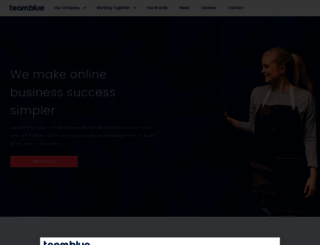
team.blue screenshot

About Website

Visit team.blue now to see the best up-to-date Team content for Turkey and also check out these interesting facts you probably never knew about team.blue

team.blue is a leading digital enabler for companies and entrepreneurs. It serves over 2 million customers in Europe and provides digital services for professionals.

Visit team.blue

Key Findings

We analyzed Team.blue page load time and found that the first response time was 634 ms and then it took 3.6 sec to load all DOM resources and completely render a web page. This is a poor result, as 60% of websites can load faster.

Performance Metrics

team.blue performance score

48

Measured Metrics

name

value

score

weighting

FCP (First Contentful Paint)

Value1.8 s

90/100

10%

LCP (Largest Contentful Paint)

Value7.8 s

3/100

25%

SI (Speed Index)

Value3.6 s

86/100

10%

TBT (Total Blocking Time)

Value740 ms

40/100

30%

CLS (Cumulative Layout Shift)

Value0.002

100/100

15%

TTI (Time to Interactive)

Value10.0 s

26/100

10%

Network Requests Diagram

team.blue

634 ms

index-main1.jpg

1035 ms

one-showroom-init.js

178 ms

index-supercharging2.jpg

1299 ms

index-teaming.jpg

1739 ms

Our browser made a total of 20 requests to load all elements on the main page. We found that 20% of them (4 requests) were addressed to the original Team.blue, 70% (14 requests) were made to I.tb-content.net and 10% (2 requests) were made to Googletagmanager.com. The less responsive or slowest element that took the longest time to load (1.7 sec) relates to the external source I.tb-content.net.

Page Optimization Overview & Recommendations

Page size can be reduced by 202.1 kB (18%)

Content Size

1.1 MB

After Optimization

916.6 kB

In fact, the total size of Team.blue main page is 1.1 MB. This result falls beyond the top 1M of websites and identifies a large and not optimized web page that may take ages to load. 25% of websites need less resources to load. Images take 879.9 kB which makes up the majority of the site volume.

HTML Optimization

-84%

Potential reduce by 151.2 kB

  • Original 180.1 kB
  • After minification 178.7 kB
  • After compression 28.9 kB

HTML content can be minified and compressed by a website’s server. The most efficient way is to compress content using GZIP which reduces data amount travelling through the network between server and browser. HTML code on this page is well minified. It is highly recommended that content of this web page should be compressed using GZIP, as it can save up to 151.2 kB or 84% of the original size.

Image Optimization

-6%

Potential reduce by 50.8 kB

  • Original 879.9 kB
  • After minification 829.1 kB

Image size optimization can help to speed up a website loading time. The chart above shows the difference between the size before and after optimization. Team images are well optimized though.

JavaScript Optimization

-0%

Potential reduce by 12 B

  • Original 38.8 kB
  • After minification 38.8 kB
  • After compression 38.7 kB

It’s better to minify JavaScript in order to improve website performance. The diagram shows the current total size of all JavaScript files against the prospective JavaScript size after its minification and compression. This website has mostly compressed JavaScripts.

CSS Optimization

-0%

Potential reduce by 50 B

  • Original 19.9 kB
  • After minification 19.9 kB
  • After compression 19.9 kB

CSS files minification is very important to reduce a web page rendering time. The faster CSS files can load, the earlier a page can be rendered. Team.blue has all CSS files already compressed.

Requests Breakdown

We found no issues to fix!

Requests Now

19

After Optimization

19

The browser has sent 19 CSS, Javascripts, AJAX and image requests in order to completely render the main page of Team. According to our analytics all requests are already optimized.

Accessibility Review

team.blue accessibility score

93

Accessibility Issues

Contrast

These are opportunities to improve the legibility of your content.

Impact

Issue

High

Background and foreground colors do not have a sufficient contrast ratio.

Navigation

These are opportunities to improve keyboard navigation in your application.

Impact

Issue

High

Heading elements are not in a sequentially-descending order

Names and labels

These are opportunities to improve the semantics of the controls in your application. This may enhance the experience for users of assistive technology, like a screen reader.

Impact

Issue

High

Links do not have a discernible name

Best Practices

team.blue best practices score

92

Areas of Improvement

Trust and Safety

Impact

Issue

High

Does not use HTTPS

Low

Ensure CSP is effective against XSS attacks

SEO Factors

team.blue SEO score

92

Search Engine Optimization Advices

Content Best Practices

Format your HTML in a way that enables crawlers to better understand your app’s content.

Impact

Issue

High

Links do not have descriptive text

Mobile Friendly

Make sure your pages are mobile friendly so users don’t have to pinch or zoom in order to read the content pages. [Learn more](https://developers.google.com/search/mobile-sites/).

Impact

Issue

High

Document uses legible font sizes

Language and Encoding

  • Language Detected

    EN

  • Language Claimed

    EN

  • Encoding

    UTF-8

Language claimed in HTML meta tag should match the language actually used on the web page. Otherwise Team.blue can be misinterpreted by Google and other search engines. Our service has detected that English is used on the page, and it matches the claimed language. Our system also found out that Team.blue main page’s claimed encoding is utf-8. Use of this encoding format is the best practice as the main page visitors from all over the world won’t have any issues with symbol transcription.

Social Sharing Optimization

Open Graph description is not detected on the main page of Team. Lack of Open Graph description can be counter-productive for their social media presence, as such a description allows converting a website homepage (or other pages) into good-looking, rich and well-structured posts, when it is being shared on Facebook and other social media. For example, adding the following code snippet into HTML <head> tag will help to represent this web page correctly in social networks: