Report Summary

  • 11

    Performance

    Renders faster than
    24% of other websites

  • 77

    Accessibility

    Visual factors better than
    that of 45% of websites

  • 75

    Best Practices

    More advanced features
    available than in
    36% of websites

  • 62

    SEO

    Google-friendlier than
    22% of websites

timus.co.jp

デザイナーズ家具の通販インテリアショップ【TIMUS】

Page Load Speed

24 sec in total

First Response

1.1 sec

Resources Loaded

22.6 sec

Page Rendered

290 ms
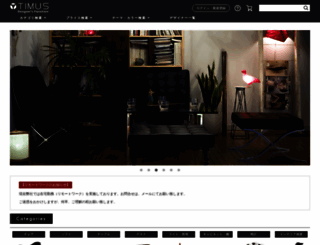
timus.co.jp screenshot

About Website

Visit timus.co.jp now to see the best up-to-date TIMUS content for Japan and also check out these interesting facts you probably never knew about timus.co.jp

イームズ、イサムノグチなどのデザイナーズ家具、インテリア雑貨を販売する通販家具ショップ

Visit timus.co.jp

Key Findings

We analyzed Timus.co.jp page load time and found that the first response time was 1.1 sec and then it took 22.9 sec to load all DOM resources and completely render a web page. This is a poor result, as 95% of websites can load faster. Unfortunately, there were 4 request timeouts, which can generally increase the web page load time, as the browser stays idle while waiting for website response.

Performance Metrics

timus.co.jp performance score

11

Measured Metrics

name

value

score

weighting

FCP (First Contentful Paint)

Value4.0 s

24/100

10%

LCP (Largest Contentful Paint)

Value16.1 s

0/100

25%

SI (Speed Index)

Value8.2 s

20/100

10%

TBT (Total Blocking Time)

Value2,150 ms

6/100

30%

CLS (Cumulative Layout Shift)

Value0.825

4/100

15%

TTI (Time to Interactive)

Value8.1 s

42/100

10%

Network Requests Diagram

timus.co.jp

1115 ms

import.css

340 ms

script.js

343 ms

jquery.min.js

518 ms

jquery.bxslider.min.js

355 ms

Our browser made a total of 170 requests to load all elements on the main page. We found that 19% of them (32 requests) were addressed to the original Timus.co.jp, 70% (119 requests) were made to Timus.jp and 2% (4 requests) were made to Cv01.con-v.jp. The less responsive or slowest element that took the longest time to load (20.1 sec) relates to the external source Cv01.con-v.jp.

Page Optimization Overview & Recommendations

Page size can be reduced by 255.4 kB (38%)

Content Size

674.5 kB

After Optimization

419.1 kB

In fact, the total size of Timus.co.jp main page is 674.5 kB. This result falls beyond the top 1M of websites and identifies a large and not optimized web page that may take ages to load. 35% of websites need less resources to load. Images take 349.6 kB which makes up the majority of the site volume.

HTML Optimization

-85%

Potential reduce by 83.2 kB

  • Original 98.5 kB
  • After minification 84.1 kB
  • After compression 15.3 kB

HTML content can be minified and compressed by a website’s server. The most efficient way is to compress content using GZIP which reduces data amount travelling through the network between server and browser. This page needs HTML code to be minified as it can gain 14.3 kB, which is 15% of the original size. It is highly recommended that content of this web page should be compressed using GZIP, as it can save up to 83.2 kB or 85% of the original size.

Image Optimization

-6%

Potential reduce by 20.6 kB

  • Original 349.6 kB
  • After minification 329.0 kB

Image size optimization can help to speed up a website loading time. The chart above shows the difference between the size before and after optimization. TIMUS images are well optimized though.

JavaScript Optimization

-65%

Potential reduce by 124.3 kB

  • Original 192.0 kB
  • After minification 182.9 kB
  • After compression 67.6 kB

It’s better to minify JavaScript in order to improve website performance. The diagram shows the current total size of all JavaScript files against the prospective JavaScript size after its minification and compression. It is highly recommended that all JavaScript files should be compressed and minified as it can save up to 124.3 kB or 65% of the original size.

CSS Optimization

-79%

Potential reduce by 27.2 kB

  • Original 34.4 kB
  • After minification 27.8 kB
  • After compression 7.2 kB

CSS files minification is very important to reduce a web page rendering time. The faster CSS files can load, the earlier a page can be rendered. Timus.co.jp needs all CSS files to be minified and compressed as it can save up to 27.2 kB or 79% of the original size.

Requests Breakdown

Number of requests can be reduced by 76 (46%)

Requests Now

165

After Optimization

89

The browser has sent 165 CSS, Javascripts, AJAX and image requests in order to completely render the main page of TIMUS. We recommend that multiple CSS and JavaScript files should be merged into one by each type, as it can help reduce assets requests from 10 to 1 for JavaScripts and from 14 to 1 for CSS and as a result speed up the page load time.

Accessibility Review

timus.co.jp accessibility score

77

Accessibility Issues

ARIA

These are opportunities to improve the usage of ARIA in your application which may enhance the experience for users of assistive technology, like a screen reader.

Impact

Issue

High

[aria-hidden="true"] elements contain focusable descendents

Internationalization and localization

These are opportunities to improve the interpretation of your content by users in different locales.

Impact

Issue

High

<html> element does not have a [lang] attribute

Names and labels

These are opportunities to improve the semantics of the controls in your application. This may enhance the experience for users of assistive technology, like a screen reader.

Impact

Issue

High

Image elements do not have [alt] attributes

High

<input type="image"> elements do not have [alt] text

High

Form elements do not have associated labels

High

Links do not have a discernible name

Best Practices

timus.co.jp best practices score

75

Areas of Improvement

Trust and Safety

Impact

Issue

High

Does not use HTTPS

High

Includes front-end JavaScript libraries with known security vulnerabilities

Low

Ensure CSP is effective against XSS attacks

User Experience

Impact

Issue

High

Serves images with low resolution

General

Impact

Issue

Low

Detected JavaScript libraries

SEO Factors

timus.co.jp SEO score

62

Search Engine Optimization Advices

Crawling and Indexing

To appear in search results, crawlers need access to your app.

Impact

Issue

High

Links are not crawlable

Content Best Practices

Format your HTML in a way that enables crawlers to better understand your app’s content.

Impact

Issue

High

Image elements do not have [alt] attributes

Language and Encoding

  • Language Detected

    JA

  • Language Claimed

    JA

  • Encoding

    EUC-JP

Language claimed in HTML meta tag should match the language actually used on the web page. Otherwise Timus.co.jp can be misinterpreted by Google and other search engines. Our service has detected that Japanese is used on the page, and it matches the claimed language. Our system also found out that Timus.co.jp main page’s claimed encoding is euc-jp. Changing it to UTF-8 can be a good choice, as this format is commonly used for encoding all over the web and thus their visitors won’t have any troubles with symbol transcription or reading.

Social Sharing Optimization

Open Graph description is not detected on the main page of TIMUS. Lack of Open Graph description can be counter-productive for their social media presence, as such a description allows converting a website homepage (or other pages) into good-looking, rich and well-structured posts, when it is being shared on Facebook and other social media. For example, adding the following code snippet into HTML <head> tag will help to represent this web page correctly in social networks: