Report Summary

  • 36

    Performance

    Renders faster than
    56% of other websites

  • 52

    Accessibility

    Visual factors better than
    that of 21% of websites

  • 83

    Best Practices

    More advanced features
    available than in
    56% of websites

  • 86

    SEO

    Google-friendlier than
    60% of websites

toolpan.com

ToolPan.com | Automotive Tools & Equipment

Page Load Speed

2.2 sec in total

First Response

453 ms

Resources Loaded

1.5 sec

Page Rendered

277 ms

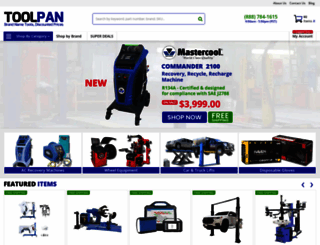
toolpan.com screenshot

About Website

Visit toolpan.com now to see the best up-to-date Tool Pan content for United States and also check out these interesting facts you probably never knew about toolpan.com

Welcome to ToolPan.com, your home for low discount prices on all of the top brand automotive tools and equipment. From basic hand tools like socket sets and torque wrenches to must have equipment like...

Visit toolpan.com

Key Findings

We analyzed Toolpan.com page load time and found that the first response time was 453 ms and then it took 1.8 sec to load all DOM resources and completely render a web page. This is quite a good result, as only 35% of websites can load faster.

Performance Metrics

toolpan.com performance score

36

Measured Metrics

name

value

score

weighting

FCP (First Contentful Paint)

Value2.9 s

52/100

10%

LCP (Largest Contentful Paint)

Value8.4 s

2/100

25%

SI (Speed Index)

Value3.9 s

82/100

10%

TBT (Total Blocking Time)

Value620 ms

48/100

30%

CLS (Cumulative Layout Shift)

Value0.708

7/100

15%

TTI (Time to Interactive)

Value6.1 s

63/100

10%

Network Requests Diagram

www.toolpan.com

453 ms

jquery.min.js

141 ms

gdf_click.js

42 ms

utilities.js

105 ms

default_modified.css

72 ms

Our browser made a total of 58 requests to load all elements on the main page. We found that 62% of them (36 requests) were addressed to the original Toolpan.com, 9% (5 requests) were made to Vendor1.leasestation.com and 7% (4 requests) were made to Nxtcfm.s3.amazonaws.com. The less responsive or slowest element that took the longest time to load (453 ms) belongs to the original domain Toolpan.com.

Page Optimization Overview & Recommendations

Page size can be reduced by 244.5 kB (15%)

Content Size

1.6 MB

After Optimization

1.4 MB

In fact, the total size of Toolpan.com main page is 1.6 MB. This result falls beyond the top 1M of websites and identifies a large and not optimized web page that may take ages to load. 45% of websites need less resources to load. Images take 1.2 MB which makes up the majority of the site volume.

HTML Optimization

-81%

Potential reduce by 38.1 kB

  • Original 47.2 kB
  • After minification 39.9 kB
  • After compression 9.1 kB

HTML content can be minified and compressed by a website’s server. The most efficient way is to compress content using GZIP which reduces data amount travelling through the network between server and browser. This page needs HTML code to be minified as it can gain 7.3 kB, which is 15% of the original size. It is highly recommended that content of this web page should be compressed using GZIP, as it can save up to 38.1 kB or 81% of the original size.

Image Optimization

-1%

Potential reduce by 6.3 kB

  • Original 1.2 MB
  • After minification 1.2 MB

Image size optimization can help to speed up a website loading time. The chart above shows the difference between the size before and after optimization. Tool Pan images are well optimized though.

JavaScript Optimization

-51%

Potential reduce by 169.0 kB

  • Original 334.0 kB
  • After minification 323.1 kB
  • After compression 165.0 kB

It’s better to minify JavaScript in order to improve website performance. The diagram shows the current total size of all JavaScript files against the prospective JavaScript size after its minification and compression. It is highly recommended that all JavaScript files should be compressed and minified as it can save up to 169.0 kB or 51% of the original size.

CSS Optimization

-84%

Potential reduce by 31.2 kB

  • Original 37.0 kB
  • After minification 23.0 kB
  • After compression 5.8 kB

CSS files minification is very important to reduce a web page rendering time. The faster CSS files can load, the earlier a page can be rendered. Toolpan.com needs all CSS files to be minified and compressed as it can save up to 31.2 kB or 84% of the original size.

Requests Breakdown

Number of requests can be reduced by 24 (44%)

Requests Now

55

After Optimization

31

The browser has sent 55 CSS, Javascripts, AJAX and image requests in order to completely render the main page of Tool Pan. We recommend that multiple CSS and JavaScript files should be merged into one by each type, as it can help reduce assets requests from 20 to 1 for JavaScripts and from 6 to 1 for CSS and as a result speed up the page load time.

Accessibility Review

toolpan.com accessibility score

52

Accessibility Issues

Names and labels

These are opportunities to improve the semantics of the controls in your application. This may enhance the experience for users of assistive technology, like a screen reader.

Impact

Issue

High

Buttons do not have an accessible name

High

Form elements do not have associated labels

High

Links do not have a discernible name

Contrast

These are opportunities to improve the legibility of your content.

Impact

Issue

High

Background and foreground colors do not have a sufficient contrast ratio.

Internationalization and localization

These are opportunities to improve the interpretation of your content by users in different locales.

Impact

Issue

High

<html> element does not have a [lang] attribute

Best practices

These items highlight common accessibility best practices.

Impact

Issue

High

[user-scalable="no"] is used in the <meta name="viewport"> element or the [maximum-scale] attribute is less than 5.

Best Practices

toolpan.com best practices score

83

Areas of Improvement

Trust and Safety

Impact

Issue

High

Does not use HTTPS

Low

Ensure CSP is effective against XSS attacks

User Experience

Impact

Issue

High

Serves images with low resolution

General

Impact

Issue

Low

Detected JavaScript libraries

SEO Factors

toolpan.com SEO score

86

Search Engine Optimization Advices

Content Best Practices

Format your HTML in a way that enables crawlers to better understand your app’s content.

Impact

Issue

High

Links do not have descriptive text

Crawling and Indexing

To appear in search results, crawlers need access to your app.

Impact

Issue

High

Links are not crawlable

Mobile Friendly

Make sure your pages are mobile friendly so users don’t have to pinch or zoom in order to read the content pages. [Learn more](https://developers.google.com/search/mobile-sites/).

Impact

Issue

High

Document uses legible font sizes

Language and Encoding

  • Language Detected

    EN

  • Language Claimed

    N/A

  • Encoding

    ISO-8859-1

Language claimed in HTML meta tag should match the language actually used on the web page. Otherwise Toolpan.com can be misinterpreted by Google and other search engines. Our service has detected that English is used on the page, and neither this language nor any other was claimed in <html> or <meta> tags. Our system also found out that Toolpan.com main page’s claimed encoding is iso-8859-1. Changing it to UTF-8 can be a good choice, as this format is commonly used for encoding all over the web and thus their visitors won’t have any troubles with symbol transcription or reading.

Social Sharing Optimization

Open Graph description is not detected on the main page of Tool Pan. Lack of Open Graph description can be counter-productive for their social media presence, as such a description allows converting a website homepage (or other pages) into good-looking, rich and well-structured posts, when it is being shared on Facebook and other social media. For example, adding the following code snippet into HTML <head> tag will help to represent this web page correctly in social networks: