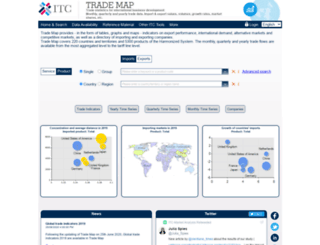
3.6 sec in total
310 ms
3.2 sec
133 ms
Click here to check amazing Trade Map content for Iran. Otherwise, check out these important facts you probably never knew about trademap.org
Trade Map - free access to world trade data (on a monthly, quarterly and yearly basis) by country, product and service, to the most detailed level
Visit trademap.orgWe analyzed Trademap.org page load time and found that the first response time was 310 ms and then it took 3.3 sec to load all DOM resources and completely render a web page. This is a poor result, as 55% of websites can load faster.
trademap.org performance score
name
value
score
weighting
Value5.6 s
6/100
10%
Value7.7 s
4/100
25%
Value5.6 s
54/100
10%
Value100 ms
98/100
30%
Value0
100/100
15%
Value7.0 s
53/100
10%
310 ms
427 ms
193 ms
193 ms
200 ms
Our browser made a total of 50 requests to load all elements on the main page. We found that 90% of them (45 requests) were addressed to the original Trademap.org, 8% (4 requests) were made to Mas-admintools.intracen.org and 2% (1 request) were made to Platform.twitter.com. The less responsive or slowest element that took the longest time to load (1 sec) belongs to the original domain Trademap.org.
Page size can be reduced by 200.3 kB (69%)
290.2 kB
89.9 kB
In fact, the total size of Trademap.org main page is 290.2 kB. This result falls beyond the top 1M of websites and identifies a large and not optimized web page that may take ages to load. 25% of websites need less resources to load. HTML takes 110.6 kB which makes up the majority of the site volume.
Potential reduce by 95.0 kB
HTML content can be minified and compressed by a website’s server. The most efficient way is to compress content using GZIP which reduces data amount travelling through the network between server and browser. HTML code on this page is well minified. It is highly recommended that content of this web page should be compressed using GZIP, as it can save up to 95.0 kB or 86% of the original size.
Potential reduce by 6.4 kB
Image size optimization can help to speed up a website loading time. The chart above shows the difference between the size before and after optimization. Obviously, Trade Map needs image optimization as it can save up to 6.4 kB or 12% of the original volume. The most popular and efficient tools for JPEG and PNG image optimization are Jpegoptim and PNG Crush.
Potential reduce by 79.0 kB
It’s better to minify JavaScript in order to improve website performance. The diagram shows the current total size of all JavaScript files against the prospective JavaScript size after its minification and compression. It is highly recommended that all JavaScript files should be compressed and minified as it can save up to 79.0 kB or 78% of the original size.
Potential reduce by 19.9 kB
CSS files minification is very important to reduce a web page rendering time. The faster CSS files can load, the earlier a page can be rendered. Trademap.org needs all CSS files to be minified and compressed as it can save up to 19.9 kB or 80% of the original size.
Number of requests can be reduced by 25 (54%)
46
21
The browser has sent 46 CSS, Javascripts, AJAX and image requests in order to completely render the main page of Trade Map. We recommend that multiple CSS and JavaScript files should be merged into one by each type, as it can help reduce assets requests from 9 to 1 for JavaScripts and from 7 to 1 for CSS and as a result speed up the page load time.
trademap.org
310 ms
Index.aspx
427 ms
Default.css
193 ms
Menus.css
193 ms
HomePage.css
200 ms
Styles.css
213 ms
Ajax.js
194 ms
Popup.js
290 ms
ScrollableNewsParams.js
291 ms
ScrollableNewsMessages_en.txt
288 ms
WebResource.axd
303 ms
ITC_Logo.gif
107 ms
TM_logo.gif
230 ms
title-TradeMap.png
225 ms
close.gif
225 ms
imprim.gif
227 ms
maximize.gif
227 ms
lockLogin.gif
342 ms
DropArrow.gif
340 ms
delete.png
339 ms
meta_red.png
339 ms
ScrollableNews.js
391 ms
social_media_twitter_follow.png
328 ms
social_media_round_icons_darkblue_32x32_facebook.png
378 ms
social_media_round_icons_lightblue_32x32_twitter.png
377 ms
social_media_round_icons_darkblue_32x32_linkedin.png
373 ms
social_media_round_icons_lightblue_32x32_youtube.png
376 ms
SilentLogin.aspx
397 ms
widgets.js
5 ms
Login.aspx
300 ms
Print.css
98 ms
Login.aspx
442 ms
RedirectToLogin.aspx
103 ms
white.css
100 ms
ajax-loader.gif
293 ms
DistanceConcentrationCountriesBubbleGraph.aspx
162 ms
LeadingMarketsMap.aspx
170 ms
GrowthCountriesBubbleGraph.aspx
158 ms
Login.aspx
1022 ms
Default.css
98 ms
DisplayToolTips.js
98 ms
ChartPic_000020.png
209 ms
ChartPic_000021.png
211 ms
DisplayToolTips.js
97 ms
DundasMap8.js
182 ms
MapPic_000150.png
108 ms
LeadingMarketsMap.aspx
353 ms
Empty.gif
97 ms
Rendering.gif
107 ms
MapPic_000151.png
109 ms
trademap.org accessibility score
Internationalization and localization
These are opportunities to improve the interpretation of your content by users in different locales.
Impact
Issue
<html> element does not have a [lang] attribute
Names and labels
These are opportunities to improve the semantics of the controls in your application. This may enhance the experience for users of assistive technology, like a screen reader.
Impact
Issue
Links do not have a discernible name
trademap.org best practices score
Trust and Safety
Impact
Issue
Does not use HTTPS
Includes front-end JavaScript libraries with known security vulnerabilities
Ensure CSP is effective against XSS attacks
General
Impact
Issue
Detected JavaScript libraries
trademap.org SEO score
Mobile Friendly
Make sure your pages are mobile friendly so users don’t have to pinch or zoom in order to read the content pages. [Learn more](https://developers.google.com/search/mobile-sites/).
Impact
Issue
Document uses legible font sizes
Tap targets are not sized appropriately
EN
N/A
UTF-8
Language claimed in HTML meta tag should match the language actually used on the web page. Otherwise Trademap.org can be misinterpreted by Google and other search engines. Our service has detected that English is used on the page, and neither this language nor any other was claimed in <html> or <meta> tags. Our system also found out that Trademap.org main page’s claimed encoding is utf-8. Use of this encoding format is the best practice as the main page visitors from all over the world won’t have any issues with symbol transcription.
trademap.org
Open Graph description is not detected on the main page of Trade Map. Lack of Open Graph description can be counter-productive for their social media presence, as such a description allows converting a website homepage (or other pages) into good-looking, rich and well-structured posts, when it is being shared on Facebook and other social media. For example, adding the following code snippet into HTML <head> tag will help to represent this web page correctly in social networks: