Report Summary

  • 0

    Performance

  • 0

    Accessibility

  • 0

    Best Practices

  • 0

    SEO

help.unicef.org

Humanitarian Aid for Children in Crisis | UNICEF USA

Page Load Speed

9.2 sec in total

First Response

820 ms

Resources Loaded

7.9 sec

Page Rendered

499 ms

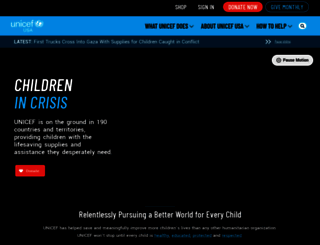
help.unicef.org screenshot

About Website

Visit help.unicef.org now to see the best up-to-date Help UNICEF content for India and also check out these interesting facts you probably never knew about help.unicef.org

Find information on UNICEF’s humanitarian aid efforts for children in crisis. Learn more about how you can help keep children safe today!

Visit help.unicef.org

Key Findings

We analyzed Help.unicef.org page load time and found that the first response time was 820 ms and then it took 8.4 sec to load all DOM resources and completely render a web page. This is a poor result, as 85% of websites can load faster.

Performance Metrics

help.unicef.org performance score

0

Network Requests Diagram

help.unicef.org

820 ms

www.unicefusa.org

128 ms

gtm.js

249 ms

APQJSHGS

479 ms

11097406100.js

383 ms

Our browser made a total of 178 requests to load all elements on the main page. We found that 1% of them (1 request) were addressed to the original Help.unicef.org, 19% (33 requests) were made to S.amazon-adsystem.com and 15% (27 requests) were made to Unicefusa.org. The less responsive or slowest element that took the longest time to load (3.4 sec) relates to the external source C.amazon-adsystem.com.

Page Optimization Overview & Recommendations

Page size can be reduced by 469.0 kB (38%)

Content Size

1.2 MB

After Optimization

769.3 kB

In fact, the total size of Help.unicef.org main page is 1.2 MB. This result falls beyond the top 1M of websites and identifies a large and not optimized web page that may take ages to load. 85% of websites need less resources to load and that’s why Accessify’s recommendations for optimization and resource minification can be helpful for this project. Javascripts take 658.0 kB which makes up the majority of the site volume.

HTML Optimization

-77%

Potential reduce by 203.6 kB

  • Original 263.1 kB
  • After minification 263.1 kB
  • After compression 59.6 kB

HTML content can be minified and compressed by a website’s server. The most efficient way is to compress content using GZIP which reduces data amount travelling through the network between server and browser. HTML code on this page is well minified. It is highly recommended that content of this web page should be compressed using GZIP, as it can save up to 203.6 kB or 77% of the original size.

Image Optimization

-0%

Potential reduce by 58 B

  • Original 248.8 kB
  • After minification 248.7 kB

Image size optimization can help to speed up a website loading time. The chart above shows the difference between the size before and after optimization. Help UNICEF images are well optimized though.

JavaScript Optimization

-40%

Potential reduce by 265.4 kB

  • Original 658.0 kB
  • After minification 657.8 kB
  • After compression 392.6 kB

It’s better to minify JavaScript in order to improve website performance. The diagram shows the current total size of all JavaScript files against the prospective JavaScript size after its minification and compression. It is highly recommended that all JavaScript files should be compressed and minified as it can save up to 265.4 kB or 40% of the original size.

CSS Optimization

-0%

Potential reduce by 7 B

  • Original 68.4 kB
  • After minification 68.4 kB
  • After compression 68.4 kB

CSS files minification is very important to reduce a web page rendering time. The faster CSS files can load, the earlier a page can be rendered. Help.unicef.org has all CSS files already compressed.

Requests Breakdown

Number of requests can be reduced by 110 (74%)

Requests Now

148

After Optimization

38

The browser has sent 148 CSS, Javascripts, AJAX and image requests in order to completely render the main page of Help UNICEF. We recommend that multiple CSS and JavaScript files should be merged into one by each type, as it can help reduce assets requests from 55 to 1 for JavaScripts and from 6 to 1 for CSS and as a result speed up the page load time.

SEO Factors

help.unicef.org SEO score

0

Language and Encoding

  • Language Detected

    EN

  • Language Claimed

    EN

  • Encoding

    UTF-8

Language claimed in HTML meta tag should match the language actually used on the web page. Otherwise Help.unicef.org can be misinterpreted by Google and other search engines. Our service has detected that English is used on the page, and it matches the claimed language. Our system also found out that Help.unicef.org main page’s claimed encoding is utf-8. Use of this encoding format is the best practice as the main page visitors from all over the world won’t have any issues with symbol transcription.

Social Sharing Optimization

Open Graph description is not detected on the main page of Help UNICEF. Lack of Open Graph description can be counter-productive for their social media presence, as such a description allows converting a website homepage (or other pages) into good-looking, rich and well-structured posts, when it is being shared on Facebook and other social media. For example, adding the following code snippet into HTML <head> tag will help to represent this web page correctly in social networks: