Report Summary

  • 11

    Performance

    Renders faster than
    24% of other websites

  • 68

    Accessibility

    Visual factors better than
    that of 33% of websites

  • 75

    Best Practices

    More advanced features
    available than in
    36% of websites

  • 96

    SEO

    Google-friendlier than
    91% of websites

unca.com

The United Nations Correspondents Association

Page Load Speed

6.5 sec in total

First Response

1.7 sec

Resources Loaded

4.3 sec

Page Rendered

505 ms
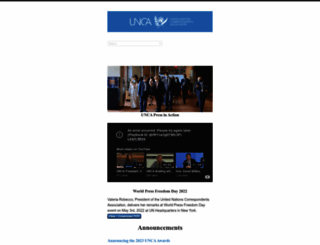
unca.com screenshot

About Website

Welcome to unca.com homepage info - get ready to check Unca best content right away, or after learning these important things about unca.com

The U.N. Correspondents Association, UNCA, is a professional organization of over 200 correspondents and producers from dozens of countries, representing scores of publications, news agencies, and bro...

Visit unca.com

Key Findings

We analyzed Unca.com page load time and found that the first response time was 1.7 sec and then it took 4.8 sec to load all DOM resources and completely render a web page. This is a poor result, as 70% of websites can load faster.

Performance Metrics

unca.com performance score

11

Measured Metrics

name

value

score

weighting

FCP (First Contentful Paint)

Value5.2 s

8/100

10%

LCP (Largest Contentful Paint)

Value18.6 s

0/100

25%

SI (Speed Index)

Value11.1 s

6/100

10%

TBT (Total Blocking Time)

Value5,700 ms

0/100

30%

CLS (Cumulative Layout Shift)

Value0.201

61/100

15%

TTI (Time to Interactive)

Value22.5 s

1/100

10%

Network Requests Diagram

unca.com

1679 ms

style.css

23 ms

advanced-responsive-video-embedder-public.css

23 ms

justifiedGallery.min.css

22 ms

flickrJustifiedGalleryWPPlugin.css

21 ms

Our browser made a total of 157 requests to load all elements on the main page. We found that 39% of them (62 requests) were addressed to the original Unca.com, 17% (26 requests) were made to Pbs.twimg.com and 6% (10 requests) were made to Instagramstatic-a.akamaihd.net. The less responsive or slowest element that took the longest time to load (2 sec) relates to the external source Connect.facebook.net.

Page Optimization Overview & Recommendations

Page size can be reduced by 2.3 MB (55%)

Content Size

4.3 MB

After Optimization

1.9 MB

In fact, the total size of Unca.com main page is 4.3 MB. This result falls beyond the top 1M of websites and identifies a large and not optimized web page that may take ages to load. 80% of websites need less resources to load and that’s why Accessify’s recommendations for optimization and resource minification can be helpful for this project. Javascripts take 2.1 MB which makes up the majority of the site volume.

HTML Optimization

-91%

Potential reduce by 230.9 kB

  • Original 254.1 kB
  • After minification 182.7 kB
  • After compression 23.2 kB

HTML content can be minified and compressed by a website’s server. The most efficient way is to compress content using GZIP which reduces data amount travelling through the network between server and browser. This page needs HTML code to be minified as it can gain 71.4 kB, which is 28% of the original size. It is highly recommended that content of this web page should be compressed using GZIP, as it can save up to 230.9 kB or 91% of the original size.

Image Optimization

-4%

Potential reduce by 44.1 kB

  • Original 1.2 MB
  • After minification 1.2 MB

Image size optimization can help to speed up a website loading time. The chart above shows the difference between the size before and after optimization. Unca images are well optimized though.

JavaScript Optimization

-71%

Potential reduce by 1.5 MB

  • Original 2.1 MB
  • After minification 2.0 MB
  • After compression 616.5 kB

It’s better to minify JavaScript in order to improve website performance. The diagram shows the current total size of all JavaScript files against the prospective JavaScript size after its minification and compression. It is highly recommended that all JavaScript files should be compressed and minified as it can save up to 1.5 MB or 71% of the original size.

CSS Optimization

-81%

Potential reduce by 575.4 kB

  • Original 710.7 kB
  • After minification 605.8 kB
  • After compression 135.2 kB

CSS files minification is very important to reduce a web page rendering time. The faster CSS files can load, the earlier a page can be rendered. Unca.com needs all CSS files to be minified and compressed as it can save up to 575.4 kB or 81% of the original size.

Requests Breakdown

Number of requests can be reduced by 83 (58%)

Requests Now

143

After Optimization

60

The browser has sent 143 CSS, Javascripts, AJAX and image requests in order to completely render the main page of Unca. We recommend that multiple CSS and JavaScript files should be merged into one by each type, as it can help reduce assets requests from 47 to 1 for JavaScripts and from 28 to 1 for CSS and as a result speed up the page load time.

Accessibility Review

unca.com accessibility score

68

Accessibility Issues

Contrast

These are opportunities to improve the legibility of your content.

Impact

Issue

High

Background and foreground colors do not have a sufficient contrast ratio.

Names and labels

These are opportunities to improve the semantics of the controls in your application. This may enhance the experience for users of assistive technology, like a screen reader.

Impact

Issue

High

<frame> or <iframe> elements do not have a title

High

Form elements do not have associated labels

High

Links do not have a discernible name

Best practices

These items highlight common accessibility best practices.

Impact

Issue

High

[user-scalable="no"] is used in the <meta name="viewport"> element or the [maximum-scale] attribute is less than 5.

Best Practices

unca.com best practices score

75

Areas of Improvement

Trust and Safety

Impact

Issue

High

Does not use HTTPS

Low

Ensure CSP is effective against XSS attacks

General

Impact

Issue

Low

Detected JavaScript libraries

High

Browser errors were logged to the console

High

Issues were logged in the Issues panel in Chrome Devtools

SEO Factors

unca.com SEO score

96

Search Engine Optimization Advices

Mobile Friendly

Make sure your pages are mobile friendly so users don’t have to pinch or zoom in order to read the content pages. [Learn more](https://developers.google.com/search/mobile-sites/).

Impact

Issue

High

Document uses legible font sizes

High

Tap targets are not sized appropriately

Language and Encoding

  • Language Detected

    EN

  • Language Claimed

    EN

  • Encoding

    UTF-8

Language claimed in HTML meta tag should match the language actually used on the web page. Otherwise Unca.com can be misinterpreted by Google and other search engines. Our service has detected that English is used on the page, and it matches the claimed language. Our system also found out that Unca.com main page’s claimed encoding is utf-8. Use of this encoding format is the best practice as the main page visitors from all over the world won’t have any issues with symbol transcription.

Social Sharing Optimization

Open Graph description is not detected on the main page of Unca. Lack of Open Graph description can be counter-productive for their social media presence, as such a description allows converting a website homepage (or other pages) into good-looking, rich and well-structured posts, when it is being shared on Facebook and other social media. For example, adding the following code snippet into HTML <head> tag will help to represent this web page correctly in social networks: