Report Summary

  • 64

    Performance

    Renders faster than
    77% of other websites

  • 91

    Accessibility

    Visual factors better than
    that of 76% of websites

  • 75

    Best Practices

    More advanced features
    available than in
    35% of websites

  • 92

    SEO

    Google-friendlier than
    74% of websites

website-performance.org

Website Performance Test

Page Load Speed

510 ms in total

First Response

33 ms

Resources Loaded

383 ms

Page Rendered

94 ms
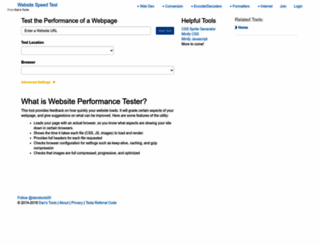
website-performance.org screenshot

About Website

Visit website-performance.org now to see the best up-to-date Website Performance content for Iran and also check out these interesting facts you probably never knew about website-performance.org

Test the speed of your webpage's load time for free. Get suggestions on ways to improve your website's speed, and improve your search ranking.

Visit website-performance.org

Key Findings

We analyzed Website-performance.org page load time and found that the first response time was 33 ms and then it took 477 ms to load all DOM resources and completely render a web page. This is quite a good result, as only 10% of websites can load faster.

Performance Metrics

website-performance.org performance score

64

Measured Metrics

name

value

score

weighting

FCP (First Contentful Paint)

Value3.3 s

41/100

10%

LCP (Largest Contentful Paint)

Value3.6 s

59/100

25%

SI (Speed Index)

Value3.3 s

91/100

10%

TBT (Total Blocking Time)

Value500 ms

58/100

30%

CLS (Cumulative Layout Shift)

Value0

100/100

15%

TTI (Time to Interactive)

Value8.3 s

39/100

10%

Network Requests Diagram

website-performance.org

33 ms

www.website-performance.org

8 ms

www.website-performance.org

24 ms

bootstrap.min.css

47 ms

font-awesome.css

55 ms

Our browser made a total of 18 requests to load all elements on the main page. We found that 44% of them (8 requests) were addressed to the original Website-performance.org, 22% (4 requests) were made to Netdna.bootstrapcdn.com and 11% (2 requests) were made to Ajax.googleapis.com. The less responsive or slowest element that took the longest time to load (180 ms) relates to the external source Pagead2.googlesyndication.com.

Page Optimization Overview & Recommendations

Page size can be reduced by 174.0 kB (39%)

Content Size

440.5 kB

After Optimization

266.6 kB

In fact, the total size of Website-performance.org main page is 440.5 kB. This result falls beyond the top 1M of websites and identifies a large and not optimized web page that may take ages to load. 45% of websites need less resources to load. Javascripts take 385.5 kB which makes up the majority of the site volume.

HTML Optimization

-82%

Potential reduce by 42.0 kB

  • Original 51.3 kB
  • After minification 36.5 kB
  • After compression 9.3 kB

HTML content can be minified and compressed by a website’s server. The most efficient way is to compress content using GZIP which reduces data amount travelling through the network between server and browser. This page needs HTML code to be minified as it can gain 14.8 kB, which is 29% of the original size. It is highly recommended that content of this web page should be compressed using GZIP, as it can save up to 42.0 kB or 82% of the original size.

JavaScript Optimization

-34%

Potential reduce by 131.5 kB

  • Original 385.5 kB
  • After minification 385.5 kB
  • After compression 254.0 kB

It’s better to minify JavaScript in order to improve website performance. The diagram shows the current total size of all JavaScript files against the prospective JavaScript size after its minification and compression. It is highly recommended that all JavaScript files should be compressed and minified as it can save up to 131.5 kB or 34% of the original size.

CSS Optimization

-12%

Potential reduce by 465 B

  • Original 3.7 kB
  • After minification 3.7 kB
  • After compression 3.3 kB

CSS files minification is very important to reduce a web page rendering time. The faster CSS files can load, the earlier a page can be rendered. Website-performance.org needs all CSS files to be minified and compressed as it can save up to 465 B or 12% of the original size.

Requests Breakdown

Number of requests can be reduced by 7 (58%)

Requests Now

12

After Optimization

5

The browser has sent 12 CSS, Javascripts, AJAX and image requests in order to completely render the main page of Website Performance. We recommend that multiple CSS and JavaScript files should be merged into one by each type, as it can help reduce assets requests from 8 to 1 for JavaScripts and as a result speed up the page load time.

Accessibility Review

website-performance.org accessibility score

91

Accessibility Issues

Contrast

These are opportunities to improve the legibility of your content.

Impact

Issue

High

Background and foreground colors do not have a sufficient contrast ratio.

Names and labels

These are opportunities to improve the semantics of the controls in your application. This may enhance the experience for users of assistive technology, like a screen reader.

Impact

Issue

High

Form elements do not have associated labels

Best Practices

website-performance.org best practices score

75

Areas of Improvement

Trust and Safety

Impact

Issue

High

Does not use HTTPS

High

Includes front-end JavaScript libraries with known security vulnerabilities

Low

Ensure CSP is effective against XSS attacks

General

Impact

Issue

Low

Detected JavaScript libraries

High

Browser errors were logged to the console

High

Page has valid source maps

SEO Factors

website-performance.org SEO score

92

Search Engine Optimization Advices

Crawling and Indexing

To appear in search results, crawlers need access to your app.

Impact

Issue

High

Links are not crawlable

Mobile Friendly

Make sure your pages are mobile friendly so users don’t have to pinch or zoom in order to read the content pages. [Learn more](https://developers.google.com/search/mobile-sites/).

Impact

Issue

High

Document uses legible font sizes

Language and Encoding

  • Language Detected

    EN

  • Language Claimed

    EN

  • Encoding

    UTF-8

Language claimed in HTML meta tag should match the language actually used on the web page. Otherwise Website-performance.org can be misinterpreted by Google and other search engines. Our service has detected that English is used on the page, and it matches the claimed language. Our system also found out that Website-performance.org main page’s claimed encoding is utf-8. Use of this encoding format is the best practice as the main page visitors from all over the world won’t have any issues with symbol transcription.

Social Sharing Optimization

Open Graph description is not detected on the main page of Website Performance. Lack of Open Graph description can be counter-productive for their social media presence, as such a description allows converting a website homepage (or other pages) into good-looking, rich and well-structured posts, when it is being shared on Facebook and other social media. For example, adding the following code snippet into HTML <head> tag will help to represent this web page correctly in social networks: