2.3 sec in total
316 ms
1.3 sec
697 ms
Welcome to dynamologic.com homepage info - get ready to check Dynamologic best content for India right away, or after learning these important things about dynamologic.com
Get professional web design services with Dynamologic Solutions. We build responsive, engaging & SEO friendly websites to boost your online presence.
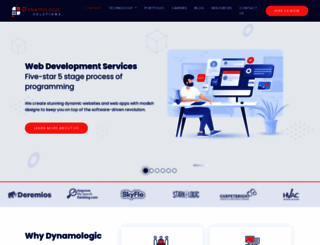
Visit dynamologic.comWe analyzed Dynamologic.com page load time and found that the first response time was 316 ms and then it took 2 sec to load all DOM resources and completely render a web page. This is quite a good result, as only 40% of websites can load faster.
dynamologic.com performance score
name
value
score
weighting
Value3.9 s
26/100
10%
Value5.8 s
15/100
25%
Value6.4 s
41/100
10%
Value2,820 ms
3/100
30%
Value0.037
100/100
15%
Value11.5 s
18/100
10%
316 ms
47 ms
65 ms
59 ms
44 ms
Our browser made a total of 88 requests to load all elements on the main page. We found that 88% of them (77 requests) were addressed to the original Dynamologic.com, 6% (5 requests) were made to Fonts.gstatic.com and 2% (2 requests) were made to Googletagmanager.com. The less responsive or slowest element that took the longest time to load (393 ms) belongs to the original domain Dynamologic.com.
Page size can be reduced by 114.9 kB (27%)
423.4 kB
308.5 kB
In fact, the total size of Dynamologic.com main page is 423.4 kB. This result falls beyond the top 1M of websites and identifies a large and not optimized web page that may take ages to load. 70% of websites need less resources to load. Javascripts take 216.8 kB which makes up the majority of the site volume.
Potential reduce by 104.1 kB
HTML content can be minified and compressed by a website’s server. The most efficient way is to compress content using GZIP which reduces data amount travelling through the network between server and browser. This page needs HTML code to be minified as it can gain 27.7 kB, which is 24% of the original size. It is highly recommended that content of this web page should be compressed using GZIP, as it can save up to 104.1 kB or 89% of the original size.
Potential reduce by 9.6 kB
Image size optimization can help to speed up a website loading time. The chart above shows the difference between the size before and after optimization. Obviously, Dynamologic needs image optimization as it can save up to 9.6 kB or 11% of the original volume. The most popular and efficient tools for JPEG and PNG image optimization are Jpegoptim and PNG Crush.
Potential reduce by 1.2 kB
It’s better to minify JavaScript in order to improve website performance. The diagram shows the current total size of all JavaScript files against the prospective JavaScript size after its minification and compression. This website has mostly compressed JavaScripts.
Number of requests can be reduced by 30 (37%)
82
52
The browser has sent 82 CSS, Javascripts, AJAX and image requests in order to completely render the main page of Dynamologic. We recommend that multiple CSS and JavaScript files should be merged into one by each type, as it can help reduce assets requests from 19 to 1 for JavaScripts and from 13 to 1 for CSS and as a result speed up the page load time.
www.dynamologic.com
316 ms
wp-emoji-release.min.js
47 ms
style.min.css
65 ms
classic-themes.min.css
59 ms
styles.css
44 ms
wpcf7-redirect-frontend.min.css
59 ms
bootstrap.min.css
51 ms
style.css
85 ms
css2
39 ms
owl.carousel.min.css
74 ms
owl.theme.default.min.css
83 ms
docs.theme.min.css
95 ms
custom.css
91 ms
resources-custom.css
103 ms
responsive-resources.css
109 ms
jquery.min.js
120 ms
jquery-migrate.min.js
120 ms
f4aeb3a8da.js
135 ms
bootstrap.min.js
132 ms
owl.carousel.js
134 ms
popper.min.js
146 ms
custom.js
174 ms
js
85 ms
js
130 ms
index.js
147 ms
index.js
151 ms
wpcf7r-fe.js
149 ms
api.js
53 ms
wp-polyfill-inert.min.js
167 ms
regenerator-runtime.min.js
166 ms
wp-polyfill.min.js
234 ms
index.js
239 ms
recaptcha__en.js
114 ms
logo.png
107 ms
sprite.png
109 ms
dots.png
108 ms
oval.png
109 ms
cube.png
109 ms
line.png
107 ms
Web-development.webp
111 ms
Mobile-app.webp
113 ms
Microsoft-technologies.webp
111 ms
Ecommerce-solution.webp
112 ms
SEO-SMM-DigitalMarketing.webp
113 ms
Web-Graphics-Designing.webp
114 ms
logo1.png
160 ms
logo2.png
163 ms
logo3.png
162 ms
logo4.png
161 ms
logo5.png
162 ms
logo6.png
163 ms
why-d-bg.png
193 ms
about-icon1.png
193 ms
about-icon2.png
193 ms
about-icon3.png
192 ms
about-icon4.png
193 ms
process-bg.webp
194 ms
p1-img.webp
333 ms
services-bg.webp
332 ms
service-icon1.png
333 ms
service-icon2.png
330 ms
service-icon3.png
331 ms
service-icon4.png
333 ms
service-icon5.png
363 ms
service-icon6.png
393 ms
work-bg.webp
392 ms
work1.webp
362 ms
work2.webp
353 ms
work3.webp
259 ms
work4.webp
291 ms
counter1-img.png
299 ms
counter2-img.png
299 ms
counter3-img.png
303 ms
counter4-img.png
304 ms
case-studies-bg.png
296 ms
case1-img.webp
306 ms
case2-img.webp
321 ms
case3-img.webp
321 ms
c1-img.webp
326 ms
c22-img.webp
328 ms
pxiEyp8kv8JHgFVrFJA.ttf
80 ms
pxiByp8kv8JHgFVrLGT9V1s.ttf
214 ms
pxiByp8kv8JHgFVrLDz8V1s.ttf
245 ms
pxiByp8kv8JHgFVrLEj6V1s.ttf
245 ms
pxiByp8kv8JHgFVrLCz7V1s.ttf
246 ms
c3-img.webp
329 ms
footer-upper-bg.webp
288 ms
footer-upper-img.webp
299 ms
dynamologic.com accessibility score
ARIA
These are opportunities to improve the usage of ARIA in your application which may enhance the experience for users of assistive technology, like a screen reader.
Impact
Issue
[aria-*] attributes do not match their roles
Names and labels
These are opportunities to improve the semantics of the controls in your application. This may enhance the experience for users of assistive technology, like a screen reader.
Impact
Issue
Buttons do not have an accessible name
Image elements do not have [alt] attributes
Links do not have a discernible name
Contrast
These are opportunities to improve the legibility of your content.
Impact
Issue
Background and foreground colors do not have a sufficient contrast ratio.
Internationalization and localization
These are opportunities to improve the interpretation of your content by users in different locales.
Impact
Issue
<html> element does not have a [lang] attribute
dynamologic.com best practices score
Trust and Safety
Impact
Issue
Does not use HTTPS
Ensure CSP is effective against XSS attacks
User Experience
Impact
Issue
Displays images with incorrect aspect ratio
Serves images with low resolution
General
Impact
Issue
Detected JavaScript libraries
Browser errors were logged to the console
Page has valid source maps
dynamologic.com SEO score
Content Best Practices
Format your HTML in a way that enables crawlers to better understand your app’s content.
Impact
Issue
Links do not have descriptive text
Image elements do not have [alt] attributes
Crawling and Indexing
To appear in search results, crawlers need access to your app.
Impact
Issue
Links are not crawlable
Mobile Friendly
Make sure your pages are mobile friendly so users don’t have to pinch or zoom in order to read the content pages. [Learn more](https://developers.google.com/search/mobile-sites/).
Impact
Issue
Document uses legible font sizes
![]()
EN
![]()
N/A
UTF-8
Language claimed in HTML meta tag should match the language actually used on the web page. Otherwise Dynamologic.com can be misinterpreted by Google and other search engines. Our service has detected that English is used on the page, and neither this language nor any other was claimed in <html> or <meta> tags. Our system also found out that Dynamologic.com main page’s claimed encoding is utf-8. Use of this encoding format is the best practice as the main page visitors from all over the world won’t have any issues with symbol transcription.
dynamologic.com
Open Graph data is detected on the main page of Dynamologic. This is the best way to make the web page social media friendly. Here is how it looks like on Facebook: